UNITED STATES
SECURITIES AND EXCHANGE COMMISSION
Washington, D.C. 20549
FORM
|
|
ANNUAL REPORT PURSUANT TO SECTION 13 OR 15(d) OF THE SECURITIES EXCHANGE ACT OF 1934 |
For the fiscal year ended
Commission File Number
BARRETT BUSINESS SERVICES, INC.
(Exact name of registrant as specified in its charter)
|
|
|
|
|
(State or other jurisdiction of |
|
(IRS Employer |
|
incorporation or organization) |
|
Identification No.) |
|
|
|
|
|
|
|
|
|
|
|
|
|
(Address of principal executive offices) |
|
(Zip Code) |
(
(Registrant's telephone number, including area code)
Securities registered pursuant to Section 12(b) of the Act:
|
Title of each class |
Trading Symbol(s) |
Name of each exchange on which registered |
|
|
|
|
Securities registered pursuant to Section 12(g) of the Act: None
Indicate by check mark if the registrant is a well-known seasoned issuer, as defined in Rule 405 of the Securities Act. Yes ☐
Indicate by check mark if the registrant is not required to file reports pursuant to Section 13 or Section 15(d) of the Act. Yes ☐
Indicate by check mark whether the registrant: (1) has filed all reports required to be filed by Section 13 or 15(d) of the Securities Exchange Act of 1934 during the preceding 12 months (or for such shorter period that the registrant was required to file such reports), and (2) has been subject to such filing requirements for the past 90 days.
Indicate by check mark whether the registrant has submitted electronically every Interactive Data File required to be submitted pursuant to Rule 405 of Regulation S-T (§ 232.405 of this chapter) during the preceding 12 months (or for such shorter period that the registrant was required to submit such files).
Indicate by check mark whether the registrant is a large accelerated filer, an accelerated filer, a non-accelerated filer, smaller reporting company, or an emerging growth company. See the definitions of “large accelerated filer,” “accelerated filer,” “smaller reporting company,” and “emerging growth company” in Rule 12b-2 of the Exchange Act.
|
Large accelerated filer ☐ |
|
Non-accelerated filer ☐ |
Smaller reporting company |
|
Emerging growth company |
|
|
|
If an emerging growth company, indicate by check mark if the registrant has elected not to use the extended transition period for complying with any new or revised financial accounting standards provided pursuant to Section 13(a) of the Exchange Act. ☐
Indicate by check mark whether the registrant has filed a report on and attestation to its management’s assessment of the effectiveness of its internal control over financial reporting under Section 404(b) of the Sarbanes-Oxley Act (15 U.S.C. 7262(b)) by the registered public accounting firm that prepared or issued its audit report.
Indicate by check mark whether the registrant is a shell company (as defined in Rule 12b-2 of the Act). Yes
State the aggregate market value of the common equity held by non-affiliates of the registrant: $
Indicate the number of shares outstanding of each of the registrant's classes of common stock, as of the latest practicable date:
|
Class |
Outstanding at February 16, 2021 |
|
Common Stock, Par Value $.01 Per Share |
|
DOCUMENTS INCORPORATED BY REFERENCE
Portions of the definitive Proxy Statement for the 2021 Annual Meeting of Stockholders are hereby incorporated by reference in Part III of Form 10-K.
BARRETT BUSINESS SERVICES, INC.
2020 ANNUAL REPORT ON FORM 10-K
TABLE OF CONTENTS
|
|
|
|
Page |
|
|
Item 1. |
|
|
2 |
|
|
|
|
|
|
|
|
Item 1A. |
|
|
9 |
|
|
|
|
|
|
|
|
Item 1B. |
|
|
19 |
|
|
|
|
|
|
|
|
Item 2. |
|
|
20 |
|
|
|
|
|
|
|
|
Item 3. |
|
|
21 |
|
|
|
|
|
|
|
|
Item 4. |
|
|
21 |
|
|
|
|
|
|
|
|
|
|
|
|
|
|
Item 5. |
|
|
21 |
|
|
|
|
|
|
|
|
Item 6. |
|
|
23 |
|
|
|
|
|
|
|
|
Item 7. |
|
Management’s Discussion and Analysis of Financial Condition and Results of Operations |
|
24 |
|
|
|
|
|
|
|
Item 7A. |
|
|
33 |
|
|
|
|
|
|
|
|
Item 8. |
|
|
34 |
|
|
|
|
|
|
|
|
Item 9. |
|
Changes in and Disagreements With Accountants on Accounting and Financial Disclosure |
|
62 |
|
|
|
|
|
|
|
Item 9A. |
|
|
62 |
|
|
|
|
|
|
|
|
Item 9B. |
|
|
65 |
|
|
|
|
|
|
|
|
|
|
|
|
|
|
Item 10. |
|
|
65 |
|
|
|
|
|
|
|
|
Item 11. |
|
|
65 |
|
|
|
|
|
|
|
|
Item 12. |
|
Security Ownership of Certain Beneficial Owners and Management and Related Stockholder Matters |
|
65 |
|
|
|
|
|
|
|
Item 13. |
|
Certain Relationships and Related Transactions, and Director Independence |
|
65 |
|
|
|
|
|
|
|
Item 14. |
|
|
65 |
|
|
|
|
|
|
|
|
|
|
|
|
|
|
Item 15. |
|
|
66 |
|
|
|
|
|
|
|
|
Item 16. |
|
|
70 |
|
|
|
|
|
||
|
|
71 |
|||
|
|
|
|
|
|
|
|
|
|
||
|
|
|
|
||
|
|
|
|
||
1
PART I
|
Item 1. |
BUSINESS |
General
Company Background
Barrett Business Services, Inc. (“BBSI,” the “Company,” “our” or “we”), is a leading provider of business management solutions for small and mid-sized companies. The Company has developed a management platform that integrates a knowledge-based approach from the management consulting industry with tools from the human resource outsourcing industry. This platform, through the effective leveraging of human capital, helps our business owner clients run their businesses more effectively. We believe this platform, delivered through a decentralized organizational structure, differentiates BBSI from our competitors. BBSI was incorporated in Maryland in 1965.
Certain statements below contain forward-looking information that is subject to risks and uncertainties. See “Forward-Looking Information” in Item 7 of Part II of this report and “Risk Factors” in Item 1A of Part I of this report.
Business Strategy
Our strategy is to align local operations teams with the mission of small and mid-sized business owners, driving value to their business. To do so, BBSI:
|
|
• |
partners with business owners to leverage their investment in human capital through a high-touch, results-oriented approach; |
|
|
• |
brings predictability to each client organization through a three-tiered management platform; and |
|
|
• |
enables business owners to focus on their core business by reducing organizational complexity and maximizing productivity. |
Business Organization
We operate a decentralized delivery model using operationally-focused business teams, typically located within 50 miles of our client companies. These teams are led by senior level business generalists and comprise senior level professionals with expertise in human resources, organizational development, risk mitigation and workplace safety, and various types of administration, including payroll. These teams are responsible for growth of their operations, and for providing strategic leadership, guidance and expert consultation to our client companies. The decentralized structure fosters autonomous decision-making in which business teams deliver plans that closely align with the objectives of each business owner client. This structure also provides a means of incubating talent to support increased growth and capacity. We support clients with employees located in 39 states and the District of Columbia through a network of 56 branch locations in California, Oregon, Arizona, Colorado, Idaho, Utah, Washington, Maryland, Nevada, Pennsylvania, Delaware, North Carolina, New Mexico, and Virginia. We also have several smaller recruiting locations in our general market areas, which are under the direction of a branch office.
2
Services Overview
BBSI’s core purpose is to advocate for business owners, particularly in the small and mid-sized business segment. Our evolution from an entrepreneurially run company to a professionally managed organization has helped to form our view that all businesses experience inflection points at key stages of growth. The insights gained through our own growth, along with the trends we see in working with more than 7,500 companies each day, define our approach to guiding business owners through the challenges associated with being an employer. BBSI’s business teams align with each business owner client through a structured three-tiered progression. In doing so, business teams focus on the objectives of each business owner and deliver planning, guidance and resources in support of those objectives.
Tier 1: Tactical Alignment
The first stage focuses on the mutual setting of expectations and is essential to a successful client relationship. It begins with a process of assessment and discovery in which the business owner’s business objectives, attitudes, and culture are aligned with BBSI’s processes, controls and culture. This stage includes an implementation process, which addresses the administrative components of employment.
Tier 2: Dynamic Relationship
The second stage of the relationship emphasizes organizational development as a means of achieving each client’s business objectives. There is a focus on process improvement, development of best practices, supervisor training and leadership development.
Tier 3: Strategic Counsel
With an emphasis on advocacy on behalf of the business owner, the third stage of the relationship is more strategic and forward-looking with a goal of cultivating an environment in which all efforts are directed by the mission and long-term objectives of the business owner.
In addition to serving as a resource and guide, BBSI has the ability to provide workers’ compensation coverage as a means of meeting statutory requirements and protecting our clients from employment-related injury claims. Through our third-party administrators, we provide claims management services for our clients. We work to manage and reduce job injury claims, identify fraudulent claims and structure optimal work programs, including modified duty.
Categories of Services
We report financial results in two categories of services: Professional Employer Services (“PEO”) and Staffing. See Item 7 of this Report for information regarding the percentages of total net revenues provided by our PEO and staffing services for each of the last three fiscal years, and our consolidated financial statements in Item 8 of Part II of this Report for information regarding revenues, net income and total assets in our single reportable segment.
PEO
We enter into a client services agreement to establish a co-employment relationship with each client company, assuming responsibility for payroll, payroll taxes, workers’ compensation coverage (if elected) and certain other administrative functions for the client’s existing workforce. We refer to employees of our PEO clients as worksite employees (“WSEs”). The client maintains physical care, custody and control of the WSEs, including the authority to hire and terminate employees. During 2020, we supported in excess of 7,500 PEO clients with an average of 108,249 WSEs. This compares to more than 7,200 PEO clients with an average of 114,341 WSEs during 2019.
3
Staffing and Recruiting
Our staffing services include on-demand or short-term staffing assignments, contract staffing, direct placement, and long-term or indefinite-term on-site management. On-site management employees are BBSI management employees who are based on the client-site and whose jobs are to assist BBSI staffing employees. Our recruiting experts maintain a deep network of professionals from which we source candidates. Through an assessment process, we gain an understanding of the short and long-term needs of our clients, allowing us to identify and source the right talent for each position. We then conduct a rigorous screening process to help ensure a successful hire.
Clients and Client Contracts
Our business is typically characterized by long-term relationships that result in recurring revenue. The terms and conditions applicable to our client relationships are set forth in a client services agreement, which typically provides for an initial term of one year with renewal for additional one-year periods, but generally permits cancellation by either party upon 30 days’ written notice. In addition, we may terminate the agreement at any time for specified breach of contract, including nonpayment or failure to follow our workplace safety recommendations.
The client services agreement also provides for indemnification by the client against losses arising out of any default by the client under the agreement, including failure to comply with any employment-related, health and safety, or immigration laws or regulations. Our client service agreement requires that clients enter into a co-employment arrangement and maintain comprehensive liability coverage in the amount of $1.0 million for acts of their employees. It is nevertheless possible that claims not satisfied through indemnification or insurance may be asserted against us, which could adversely affect our results of operations.
We have client services agreements with a diverse array of customers, including electronics manufacturers, various light-manufacturing industries, agriculture-based companies, transportation and shipping enterprises, food processors, telecommunications companies, public utilities, general contractors in various construction-related fields, and professional services firms. None of our clients individually represented more than 1% of our total revenues in 2020.
Market Opportunity
As a company that aligns with the mission of business owners by providing resources and guidance to small and mid-size businesses, BBSI believes its growth is driven by the desire of business owners to focus on mission-critical functions, reduce complexity associated with the employment function, mitigate costs and maximize their investment in human capital. Our integrated management platform has enabled us to capitalize on these needs within the small to mid-size business sector.
The small and mid‑sized business segment is particularly attractive because:
|
|
• |
it is large, continues to offer significant growth opportunity and remains underserved by professional services companies; |
|
|
• |
it typically has fewer in-house resources than larger businesses and, as a result, is generally more dependent on external resources; |
|
|
• |
we generally experience a relatively high client retention rate and lower client acquisition costs within this market segment; and |
|
|
• |
we have found that small to mid-sized businesses are responsive to quality of service when selecting a PEO or staffing services provider. |
4
Competition
The business environment in which we operate is characterized by intense competition and fragmentation. BBSI is not aware of reliable statistics regarding the number of its competitors, but certain large, well-known companies typically compete with us in the same markets and also have greater financial and marketing resources than we do, including Automatic Data Processing, Inc., ManpowerGroup, Inc., Kelly Services, Inc., Insperity, Inc., TriNet Group, Inc., Robert Half International Inc. and Paychex, Inc. We face additional competition from regional providers and we may in the future also face competition from new entrants to the field, including other staffing services companies, payroll processing companies and insurance companies. The principal competitive factors in the business environment in which we operate are price and level of service.
We believe that our growth is attributable to our ability to provide small and mid-sized companies with the resources and knowledge base of a large employer delivered through a local operations team. Our level of integration with each client business provides us an additional competitive advantage.
Technology Platform
Our client-facing technology platform, myBBSI, includes both internally developed and licensed software which gives our clients a wide range of tools, including the ability to process payroll, collect and process time and attendance information, manage human resource information including employee onboarding and termination, as well as compensation and payroll tax reporting.
Growth Strategy
We believe our clients are our best advocates and powerful drivers of referral-based growth. In each market, operations teams provide expertise, consultation and support to our clients, driving growth and supporting retention. We anticipate that by adding business teams to existing branches, we can achieve incremental growth in those markets, driven by our reputation and by client referrals. While in most markets business development efforts are led by area managers, in some markets our sales efforts are further supported by business development managers.
Our business growth has three primary sources: referrals from existing clients, direct business-to-business sales efforts by our area managers, and an extensive referral network. Partners in our referral network include insurance brokers, financial advisors, attorneys, CPA’s, and other business professionals who can facilitate an introduction to prospective clients. These referral partners facilitate introductions to business owners on our behalf, typically in exchange for a fee equal to a small percentage of payroll.
We see two key drivers to our growth:
|
|
• |
Increase market share in existing markets. We seek to support, strengthen and expand branch office operations through the ongoing development of business teams. We believe that strengthening and expanding the operations of each location is an efficient and effective means of increasing market share in the geographic areas in which we do business, and that our business teams serve a dual purpose: 1) Delivering high-quality service to our clients, thereby supporting client business growth and retention, and driving client referrals, and 2) Incubating talent at the branch level to support expansion into new markets. |
|
|
• |
Penetrate new markets. We intend to open additional branch offices in new geographic markets as opportunities arise. We have developed a strategic approach to geographic expansion, which will serve as a guide for determining if and when to enter new markets. As part of this effort, we have become licensed to provide PEO services nationwide. We believe our decentralized organizational model built on teams of senior-level professionals allows us to incubate talent to support our expansion efforts. |
5
Workers’ Compensation
Through our client services agreement, BBSI has the ability to provide workers’ compensation coverage to its clients. We provide this coverage through a variety of methods, all of which are subject to rigorous underwriting to assess financial stability, risk factors and cultural alignment related to safety and the client’s desire to improve their operations. In providing this coverage, we are responsible for complying with applicable statutory requirements for workers' compensation coverage.
Risk mitigation is also an important contributor to our principal goal of helping business owners operate their business more efficiently. It is in the mutual interests of the client and BBSI to commit to workplace safety and risk mitigation. We maintain clear guidelines for our area managers and risk management consultants, directly tying their continued employment to their diligence in understanding and addressing the risks of accident or injury associated with the industries in which client companies operate and in monitoring clients’ compliance with workplace safety requirements.
Elements of Workers' Compensation System
State law (and for certain types of employees, federal law) generally mandates that an employer reimburse its employees for the costs of medical care and other specified benefits for injuries or illnesses, including catastrophic injuries and fatalities, incurred in the course and scope of employment. Most states require employers to maintain workers' compensation insurance or otherwise demonstrate financial responsibility to meet workers' compensation obligations to employees. The benefits payable for various categories of claims are determined by state regulation and vary with the severity and nature of the injury or illness and other specified factors. In return for this guaranteed protection, workers' compensation is an exclusive remedy and employees are generally precluded from seeking other damages from their employer for workplace injuries. In many states, employers who meet certain financial and other requirements are permitted to self-insure.
Insurance Coverage for Workers' Compensation
The Company is a self-insured employer with respect to workers' compensation coverage for all of its employees (including employees co-employed through our client service agreements) working in Colorado, Maryland and Oregon. In the state of Washington, state law allows only the Company's staffing services and internal management employees to be covered under the Company's self-insured workers' compensation program. The Company also operates a wholly owned, fully licensed insurance company, Ecole, which provides workers’ compensation coverage to the Company’s employees working in Arizona and Utah.
For all other clients, the Company obtains policies from Chubb Limited (“Chubb”) through an arrangement known as a fronted program, which provides a licensed, admitted insurance carrier to issue policies on behalf of the Company. Chubb assumes credit risk should the Company be unable to satisfy its indemnification obligations.
Through various insurance arrangements, the Company retains risk of loss up to the first $3.0 million per occurrence, except in Maryland and Colorado, where our retention per occurrence is $1.0 million and $2.0 million, respectively. For claims incurred prior to July 1, 2020, the Company retains risk of loss up to the first $5.0 million per occurrence, except in Maryland and Colorado, where the retention per occurrence is $1.0 million and $2.0 million, respectively.
6
Claims Management
As a result of our status as a self-insured employer in four states and our retention arrangements, our workers' compensation expense is tied directly to the incidence and severity of covered workplace injuries. We seek to contain our workers' compensation costs through a comprehensive approach to claims management. We use managed-care systems to reduce medical costs and keep time-loss costs to a minimum by assigning injured workers, whenever possible, to short-term assignments which accommodate the workers' physical limitations. We believe that these assignments minimize both time actually lost from work and covered time-loss costs. We engage a third-party claims administrator ("TPA") to provide the primary claims management expertise. Typical claims management procedures include performing thorough and prompt on-site investigations of claims filed by employees, working with physicians to encourage efficient medical management of cases, denying questionable claims and attempting to negotiate early settlements to eliminate future adverse development of claims costs. We also maintain a corporate-wide pre-employment drug screening program and a post-injury drug test program. We believe our claims management program has resulted in a reduction in the frequency of fraudulent claims and in accidents in which the use of illicit drugs appears to have been a contributing factor.
Human Capital
At December 31, 2020, we had 115,075 total employees, including 109,292 WSEs under our PEO client service agreements, 5,084 staffing services employees, 695 managerial, sales and administrative employees (together, “management employees”), and 4 executive officers. The number of employees at any given time may vary significantly due to business conditions at customer or client companies. We believe our employee relations with management employees are good.
BBSI believes that making significant investments in the best management employee talent available allows us to leverage the value of this investment many times over. Additionally, we believe our Company’s success depends on our ability to attract, develop and retain our workforce. As such, we strive to be an employer of choice and promote the health, welfare and safety of our employees. This involves promoting diversity and treating all employees with dignity and respect, while providing our management employees with fair, market-based, competitive and equitable compensation.
We motivate our management employees through a compensation package that includes a competitive base salary and the opportunity for profit sharing. At the branch level, profit sharing is in direct correlation to client performance, reinforcing a culture focused on achievement of client goals. We also provide a comprehensive benefits package as well as an employee stock purchase plan. We seek feedback from employees regarding our benefits package through employee surveys. This information is used by management to make improvements as we continuously strive to be an employer of choice.
We offer various qualified employee benefit plans to our employees, including those employees for whom we are the administrative employer in a co-employment arrangement who so elect. Employees covered under a PEO arrangement may participate in our 401(k) plan at the sole discretion of the PEO client. Our qualified staffing and management employee benefit plans include our 401(k) plan, in which employees may enroll upon reaching 21 years of age and completing 1,000 hours of service in a 12 consecutive month period. We make matching contributions to the 401(k) plan under a safe harbor provision, which are immediately 100% vested. We match 100% of contributions by management and staffing employees up to 3% of each participating employee's annual compensation and 50% of the employee's contributions up to an additional 2% of annual compensation. We may also make discretionary contributions to the 401(k) plan, which vest over six years and are subject to certain legal limits, at the sole discretion of our Board of Directors.
We also offer a cafeteria plan under Section 125 of the Internal Revenue Code and group health, life insurance and disability insurance plans to qualified staffing and management employees. Generally, qualified employee benefit plans are subject to provisions of both the Internal Revenue Code and the Employee Retirement Income Security Act of 1974 ("ERISA").
7
Certain highly compensated employees of the Company are allowed to participate in a nonqualified deferred compensation plan. Under the plan, participants are permitted to defer receipt for income tax purposes of up to 90% of salary and up to 100% of any incentive bonus. Participants earn a return on their deferred compensation based on investment earnings of participant-selected investments. As an incentive to participate in the plan, the Company awards restricted stock units with a value equal to 35% of the amount deferred under the plan, up to a maximum of $75,000 per year. The restricted stock units vest in full on the fifth anniversary of the grant date, contingent on the continued employment of the participant.
The Company established a Rabbi trust under which compensation deferred by participants is deposited and held separately from the Company's other assets, subject to the claims of the Company's creditors in the event of its bankruptcy or insolvency.
The Patient Protection and Affordable Care Act and the Health Care and Education Reconciliation Act of 2010 (collectively, the “Acts”) subject us to potential penalties unless we offer to our employees minimum essential healthcare coverage that is affordable. Because each PEO client is considered to be the sole employer in the application of any rule or law included within the scope of the Acts, we do not offer health care coverage to the WSEs of our PEO clients. However, in order to comply with the employer mandate provision of the Acts, we offer health care coverage to all eligible staffing employees and management employees eligible for coverage under the Acts.
In response to the COVID-19 pandemic in March 2020, we transitioned much of our workforce to a remote working environment with a commitment to the safety of our employees and the communities we serve. In the third quarter of 2020, we began re-opening offices on a limited basis to accommodate employees seeking the flexibility to work from the office, while continuing to adhere to health and safety protocols.
Regulatory and Legislative Environment
We are subject to the laws and regulations of the jurisdictions within which we operate, including those governing self-insured employers under the workers' compensation systems in Oregon, Maryland, and Colorado, as well as in Washington for staffing and management employees. We are also subject to laws and regulations governing our two wholly owned insurance companies in Arizona. While the specific laws and regulations vary among these jurisdictions, they typically require some form of licensing and often have statutory requirements for workplace safety and notice of change in obligation of workers’ compensation coverage in the event of contract termination. Although compliance with these requirements imposes some additional financial risk, particularly with respect to those clients who breach their payment obligation to us, such compliance has not had a material adverse effect on our business to date.
Our operations are affected by numerous federal and state laws relating to labor, tax and employment matters. Through our client services agreement, we assume certain obligations and responsibilities as the administrative employer under federal and state laws. Since many of these federal and state laws were enacted prior to the development of nontraditional employment relationships, such as professional employer, temporary employment, and outsourcing arrangements, many of these laws do not specifically address the obligations and responsibilities of nontraditional employers. In addition, the definition of "employer" under these laws is not uniform.
As an employer, we are subject to all federal statutes and regulations governing our employer-employee relationships for staffing and management employees. Subject to the discussion of risk factors below, we believe that our operations are in compliance in all material respects with applicable federal statutes and regulations.
Due to the nature of our operations, we collect, store, process, use and retain significant amounts of confidential and sensitive personal employee and client information. As such, we are subject to a variety of federal and state laws and regulations associated with data security.
8
Additional Information
Our filings with the SEC, including our annual report on Form 10-K, quarterly reports on Form 10-Q, periodic reports on Form 8-K and amendments to these reports, are accessible free of charge at our website at http://www.bbsi.com as soon as reasonably practicable after they are electronically filed with the SEC. By making this reference to our website, we do not intend to incorporate into this report any information contained in the website. The website should not be considered part of this report.
Materials that the Company files with the SEC may be read and copied at the SEC’s Public Reference Room at 100 F Street, NE., Washington, DC 20549. Information on the operation of the Public Reference Room may be obtained by calling the SEC at 1-202-551-8090 or by e-mail at publicinfo@sec.gov. The SEC also maintains a website at http://www.sec.gov that contains reports, proxy and information statements, and other information regarding issuers with publicly traded securities, including the Company.
|
Item 1A. |
RISK FACTORS |
In addition to other information contained in this report, the following risk factors should be considered carefully in evaluating our business.
Risks Relating to the COVID-19 Pandemic
The Company’s business may be negatively affected by outbreaks of disease, such as epidemics or pandemics, including the ongoing COVID-19 pandemic.
In March 2020, the World Health Organization and the United States government declared COVID-19 a pandemic and recommended containment and mitigation measures worldwide. In response to the COVID-19 pandemic, state governments nationwide, including the states where BBSI and our clients operate, have taken, and continue to take, preventative actions such as shelter-in-place orders, restrictions on travel, and temporary closures of businesses deemed to be high-risk or non-essential. These restrictions on business operations have significantly disrupted, and will continue to disrupt, the U.S. economy, including small-and mid-sized businesses, which comprise our primary client base. Our clients have experienced, and will continue to experience, workforce reductions in the form of layoffs, furloughs, and reductions in hours worked, resulting in reduced payroll costs. As our PEO fees are based on client payroll, these responses by clients to the pandemic could have a material adverse effect on our business. Additionally, clients who are impacted by government restrictions and shutdowns may experience liquidity and other financial issues, which may impact their ability to pay for our services.
In response to the pandemic, federal and state government agencies have enacted numerous laws and regulatory guidelines designed to help the economy, individuals and employers, including retroactively. Many of these legislative and regulatory changes, including the Families First Coronavirus Relief Act (FFCRA), the Coronavirus Aid, Relief, and Economic Security (CARES) Act, and the Taxpayer Certainty and Disaster Tax Relief Act of 2020, directly impact the Company and our clients. Failure to appropriately interpret and comply with legal and regulatory changes arising from the COVID-19 pandemic could have a material adverse effect on our business and reputation. Additionally, failure to incorporate changes to laws and regulations resulting from COVID-19 into our PEO business model may decrease our ability to attract and retain clients.
Additionally, many states have revised their workers’ compensation standards of coverage to include COVID-19 related illnesses for certain groups of workers. While effects on the Company’s workers’ compensation exposure in the states in which we operate have been limited to date, these changes in laws and regulations or in the pattern of COVID-19 illnesses could increase our exposure to workers’ compensation claims.
9
Due to the ongoing COVID-19 outbreak and related government mandates, the Company has transitioned much of its workforce to a temporary remote working model, which may adversely affect the Company’s ability to provide the level of service our clients expect. As our employees work from home and access the Company’s systems remotely, the Company may be exposed to heightened security risks, including the risk of cyber-attacks. Additionally, if any of the Company’s key management employees are unable to perform their duties for an extended period, including as the result of illness, the Company’s business could be adversely affected.
The COVID-19 pandemic has also caused significant volatility and uncertainty in the U.S. economy that may result in a prolonged economic downturn, which could in turn lead to increases in workers’ compensation and unemployment claims, increased unemployment taxes, increased uncollectable receivables and reductions in the value of the Company’s investment portfolio.
Continuation or exacerbation of the consequences of the pandemic described above and elsewhere in this report is likely to have a material adverse effect on our business, cash flows, results of operations and financial condition, which may also result in our inability to comply with financial covenants under our credit facilities, our inability to obtain necessary additional financing and a decline in stockholder value.
Risks Relating to Workers’ Compensation
Our consolidated retention for workers' compensation claims is $3.0 million per occurrence under our insurance arrangement with Chubb in the majority of states in which we operate.
We maintain our consolidated retention at $3.0 million per occurrence, except in Maryland and Colorado where our retention is at $1.0 million and $2.0 million per occurrence, respectively, due to regulatory requirements. For claims incurred prior to July 1, 2020, we maintain our consolidated retention at $5.0 million per occurrence, except in Maryland and Colorado where our retention is at $1.0 million and $2.0 million per occurrence, respectively. The Company maintains its excess workers’ compensation insurance coverage with Chubb. Additionally, Ecole’s retention is at $3.0 million per occurrence for coverage in Arizona and Utah. For claims incurred prior to July 1, 2020, Ecole’s retention is at $5.0 million per occurrence for coverage in Arizona, Utah and Nevada. Thus, the Company has financial risk for most workers' compensation claims under $3.0 million on a per occurrence basis for claims incurred on or after July 1, 2020 and $5.0 million on a per occurrence basis for claims incurred before July 1, 2020. This level of per occurrence retention may result in higher workers’ compensation costs to us with a corresponding negative effect on our operating results and financial condition.
Our ability to continue our business operations under our present service model is dependent on maintaining workers' compensation insurance coverage.
Our arrangement with Chubb to provide workers’ compensation coverage to BBSI’s PEO clients extends through June 30, 2021, with committed coverage through June 30, 2022, and the possibility of additional annual renewals. If Chubb is unwilling or unable to renew our arrangement in the future, we would need to seek alternative coverage. If replacement coverage were unavailable or available only on significantly less favorable terms, our business and results of operations would be materially adversely affected.
Collateral requirements could increase beyond our ability to satisfy those requirements.
The Company is required to provide collateral for its fronted program and by certain states related to its current and former status as a self-insured employer. Various factors, including adverse loss experience or a decline in the fair value of investments in our collateral accounts, could cause the counterparties to require that additional collateral be posted. To partially satisfy these collateral requirements, the Company has provided surety bonds and standby letters of credit. If there are significant changes to the market for these credit products, or if we are unable to renew these agreements, we may incur increased costs or be required to deposit additional capital as collateral.
10
Failure to manage the severity and frequency of workplace injuries will increase our workers’ compensation expenses.
Significant increases in the relative frequency or severity of workplace injuries due to failures to accurately assess potential risks or assure implementation of effective safety measures by our clients may result in increased workers’ compensation claims expenses, with a corresponding negative effect on our results of operations and financial condition.
Risks Related to Technology
To succeed, we must constantly improve our technology to meet the expectations of our clients. If we fail to meet those expectations, we may lose clients and harm our business.
In order to attract and retain clients and satisfy their expectations, the software, hardware and networking technologies we use must be frequently and rapidly upgraded, enhanced and improved in response to technological advances, competitive pressures, client expectations, and new and changing laws. Failure to successfully implement technological improvements could result in harm to our reputation, loss of market share, reduced revenue, or client claims against us, any of which could materially harm our business.
As we continue to invest in upgrades or replacements to our existing systems, including enhancements and additional security measures, we may incur substantial costs and risks relating to development, installation and implementation, including disruptions in our service offerings or increases in expected costs, which may have a material adverse effect on our operating results and financial condition.
We are dependent upon technology services, and if we experience damage, service interruptions or failures in our computer and telecommunications systems, our client relationships and our ability to attract new clients may be adversely affected.
We rely extensively on computer systems to provide service offerings to our clients, manage our branch network, perform employment-related services and accounting and reporting functions, and summarize and analyze our financial results. Our systems are subject to damage or interruption from telecommunications failures, power-related outages, third-party disruptions, computer viruses and malicious attacks, security breaches and catastrophic events. If our systems are damaged or fail to function properly, we may incur substantial costs to repair or replace them, experience loss of critical data and interruptions or delays in our ability to manage our operations, and encounter a loss of client confidence. In addition, our clients’ businesses may be adversely affected by any system or equipment failure or breach we experience. As a result, we may suffer damage to our reputation, we may lose clients, our ability to attract new clients may be adversely affected, and we could be exposed to contractual liability.
We depend on third-party software in order to provide our services and support our operations.
Significant portions of our services and operations rely on software that is licensed from third-party vendors. The fees associated with these license agreements could increase in future periods, resulting in increased operating expenses. If there are significant changes to the terms and conditions of our license agreements, or if we are unable to renew these license agreements, we may be required to make changes to our vendors or information technology systems. These changes may impact the services we provide to our clients or the processes we have in place to support our operations, which could have an adverse effect on our business.
11
We could be subject to reduced revenues, increased costs, liability claims, or harm to our reputation as a result of data theft, cyberattacks or other security vulnerabilities.
The nature of our business involves the receipt, storage, and transmission of personal and proprietary information about thousands of employees and clients. Attacks on information technology systems continue to grow in frequency and sophistication, and we and our third-party vendors are targeted by unauthorized parties using malicious tactics, code and viruses. Hardware or applications we develop or procure from third-party vendors may contain defects in design or other problems that could unexpectedly compromise the confidentiality, integrity or availability of data or our systems. Because the techniques used to obtain unauthorized access and disable or sabotage systems change frequently and may be difficult to detect for long periods of time, we and our third-party vendors may be unable to anticipate these techniques or implement adequate preventive measures. As these threats continue to evolve, we may be required to invest significant additional resources to modify and enhance our information security and controls or to investigate and remediate any security vulnerabilities. While our technology infrastructure is designed to safeguard and protect personal and business information, we have limited ability to monitor the implementation of similar safeguards by our vendors.
Any cyberattack, unauthorized intrusion, malicious software infiltration, network disruption, corruption of data, misuse or theft of private or other sensitive information, or inadvertent acts by our own employees, could result in the disclosure or misuse of confidential or proprietary information, which could have a material adverse effect on our business operations or that of our clients. If we experience a significant data security breach or fail to detect and appropriately respond to a significant data security breach, we could be exposed to government enforcement actions and private litigation. These losses may exceed our insurance coverage for such incidents. In addition, our employees and clients could lose confidence in our ability to protect their personal and proprietary information, which could cause them to terminate their relationships with us. Any loss of confidence arising from a significant data security breach could hurt our reputation, further damaging our business.
Other Risks Related to our Business and Industry
In order to continue to grow revenues, we are dependent on retaining current clients and attracting new clients.
The Company’s revenue growth can be volatile and is dependent on same customer sales and the addition of new clients. Revenues decreased 6.5% in 2020 and increased 0.2% in 2019. There can be no assurance that we will continue to maintain current levels of revenues. Efforts to achieve business growth intensifies pressure on retaining current clients and attracting increasing numbers of new clients.
Our business is subject to risks associated with geographic market concentration.
Our California operations accounted for approximately 75% of our total revenues in 2020. As a result of the current importance of our California operations and anticipated continued growth from these operations, our profitability over the next several years is expected to be largely dependent on economic and regulatory conditions in California. If California experiences an economic downturn, or if the regulatory environment changes in a way that adversely affects our ability to do business or limits our competitive advantages, our profitability and growth prospects may be materially adversely affected. Similarly, due to our geographic concentration in California, a natural disaster or major event that disrupts these markets or the related workforce could have an immediate and material adverse impact on our operations and profitability.
12
Economic conditions, particularly in California, may impact our ability to attract new clients and cause our existing clients to reduce staffing levels or cease operations.
Weak economic conditions typically have a negative impact on small-and mid-sized businesses, which make up the majority of our clients. In turn, these businesses could cut costs, including trimming employees from their payrolls, or closing locations or ceasing operations altogether. If current economic conditions were to weaken further, these forces may result in decreased revenues due both to the downsizing of our current clients and increased difficulties in attracting new clients in a poor economic environment. In addition, weak economic conditions may also result in additional bad debt expense to the extent that existing clients cease operations or are otherwise unable to meet their financial obligations.
Our staffing business is vulnerable to economic fluctuations.
Demand for our staffing services is sensitive to changes in the level of economic activity in the regions in which we do business. As economic activity slows down, companies often reduce their use of temporary employees before undertaking layoffs of permanent staff, resulting in decreased demand for staffing services. During strong economic periods, on the other hand, we often experience shortages of qualified employees to meet customer needs, as occurred during 2020.
Because we assume the obligation to make wage, tax and regulatory payments in respect of some employees, we are exposed to client credit risks.
We generally assume credit risk associated with our clients’ employee payroll obligations, including liability for payment of salaries and wages (including payroll taxes), as well as retirement benefits. These obligations are fixed whether or not the client makes payments to us as required by our services agreement. We attempt to mitigate this risk by invoicing our clients at the end of their specific payroll processing cycle. We also carefully monitor the timeliness of our clients' payments and impose strict credit standards on our customers. If we fail to successfully manage our credit risk, our results of operations and financial condition could be materially and adversely affected.
Increases in unemployment claims could raise our state and federal unemployment tax rates which we may not be able to pass on to our customers.
During weak economic conditions in our markets, the level of unemployment claims tends to rise as a result of employee layoffs at our clients and lack of work in our temporary staffing pool. The rise in unemployment claims often results in higher state and federal unemployment tax rates, which in most instances cannot be concurrently passed on to our customers either due to existing client services agreements or competitive pricing pressures. Increases in our state and federal unemployment tax rates could have a material adverse effect on our results of operations, particularly in the early part of the calendar year when payroll tax rates are at or near their maximum.
Changes in federal and state unemployment tax laws and regulations could adversely affect our business.
In past years, there has been significant negative publicity relating to the use of staffing or PEO companies to shield employers from poor unemployment history and high unemployment taxes. New legislation enacted at the state or federal level to try to counter this perceived problem could have a material adverse effect on our business by limiting our ability to market our services or making our services less attractive to our customers and potential customers.
13
If we are unable to maintain our brand image and corporate reputation, our business may suffer.
Our success depends in part on our ability to maintain our reputation for providing excellent service to our customers. Service quality issues, whether actual or perceived, and even when false or unfounded, could tarnish the image of our brand and may cause customers to use other companies. Also, adverse publicity surrounding labor relations, data breaches, SEC investigations, and the like, could negatively affect our overall reputation. Damage to our reputation could reduce demand for our services and thus have an adverse effect on our business, financial condition and results of operations.
Our service agreements may be terminated on short notice, leaving us vulnerable to a significant loss of customers in a short period of time, if business or regulatory conditions change or events occur that negatively affect our reputation.
Our client services agreements are generally terminable on 30 days’ notice by either us or our client. As a result, our clients may terminate their agreement with us at any time, making us particularly vulnerable to changing business or regulatory conditions or changes affecting our reputation or the reputation of our industry.
We may be exposed to employment‑related claims and costs and periodic litigation that could adversely affect our business and results of operations.
We either co-employ employees in connection with our PEO client services agreements or place our employees in our customers' workplace in connection with our staffing business. As such, we are subject to a number of risks inherent to our status as the administrative employer, including without limitation:
|
|
• |
claims of misconduct or negligence on the part of our employees, discrimination or harassment claims against our employees, or claims by our employees of discrimination or harassment by our clients; |
|
|
• |
immigration-related claims; |
|
|
• |
claims relating to violations of wage, hour and other workplace regulations; |
|
|
• |
claims relating to employee benefits, entitlements to employee benefits, or errors in the calculation or administration of such benefits; and |
|
|
• |
possible claims relating to misuse of customer confidential information, misappropriation of assets or other similar claims. |
If we experience significant incidents involving any of the above-described risk areas, we could face substantial out-of-pocket losses, fines or negative publicity. In addition, such claims may give rise to litigation, which may be time consuming, distracting and costly, and could have a material adverse effect on our business. With respect to claims involving our co-employer relationships, although our client services agreement provides that the client will indemnify us for any liability attributable to the conduct of the client or its employees, we may not be able to enforce such contractual indemnification, or the client may not have sufficient assets to satisfy its obligations to us. An increase in employment-related claims against us may have a material adverse effect on our results of operations.
We are dependent upon certain key personnel and recruitment and retention of key employees may be difficult and expensive.
We believe that the successful operation of our business is dependent upon our retention of the services of key personnel, including our Chief Executive Officer, other executive officers and area managers. We may not be able to retain all of our executives, senior managers and key personnel in light of competition for their services. If we lose the services of one of our executive officers or a significant number of our senior managers, our results of operations likely would be adversely affected.
14
We depend on attracting and retaining qualified employees; during periods of economic growth, our costs to do so increase and attracting and retaining people becomes more difficult.
Our teams of client-facing professionals are the foundation of our value proposition. Our ability to attract and retain qualified personnel could be adversely affected by lower unemployment rates and higher compensation levels. During periods of economic growth, we face increased competition for retaining and recruiting qualified personnel, resulting in higher advertising and recruiting costs and increased salary expenses. If we cannot attract and retain qualified employees, the quality of our services may deteriorate and our reputation and results of operations could be adversely affected.
We do not have an expansive in-house sales staff and therefore rely extensively on referral partners.
We currently maintain a minimal internal professional sales force, instead relying heavily on referral partners to provide referrals to new business. In connection with these arrangements, we pay a fee to referral partners for new clients. These referral firms and individuals do not have an exclusive relationship with us. If we are unable to maintain these relationships or if our referral partners increase their fees or lose confidence in our services, we could face declines in our business and additional costs and uncertainties as we attempt to hire and train an internal sales force.
Our business is subject to risks associated with healthcare reforms.
The Patient Protection and Affordable Care Act and the Health Care and Education Reconciliation Act of 2010 (collectively, the “Acts”) subject us to potential penalties unless we offer our employees minimum essential healthcare coverage that is affordable. In order to comply with the employer mandate provision of the Acts, we offer health care coverage to all temporary and permanent employees eligible for coverage under the Acts other than employees of our PEO clients, which are responsible for providing required health care coverage to their employees. Designating employees as eligible is complex and is subject to challenge by employees and the Internal Revenue Service (“IRS”). While we believe we have properly identified eligible employees, a later determination that we failed to offer the required health coverage to eligible employees could result in penalties that may materially harm our business. We cannot be certain that compliant insurance coverage will remain available to us on reasonable terms, and we could face additional risks arising from future changes to or repeal of the Acts or changed interpretations of our obligations under the Acts. There can be no assurance that we will be able to recover all related costs through increased pricing to our customers or that such costs will be recovered in the period in which costs are incurred, and the net financial impact on our results of operations could be significant.
We face competition from a number of other companies.
We face competition from various companies that may provide all or some of the services we offer. Our competitors include companies that are engaged in staffing services such as Robert Half International Inc., Kelly Services, Inc., and ManpowerGroup Inc.; companies that are focused on co-employment, such as Insperity, Inc., and TriNet Group, Inc.; and companies that primarily provide payroll processing services, such as Automatic Data Processing, Inc. and Paychex, Inc. We also compete with insurance carriers and other providers of workers’ compensation insurance, and our offerings must be priced competitively with prices provided by these competitors in order for us to attract and retain our clients. Maintaining competitive pricing in the workers’ compensation market could lead to reduced margins and profitability. Additionally, we face competition from information technology outsourcing firms and broad-based outsourcing and consulting firms that perform individual projects.
15
Several of our existing or potential competitors have substantially greater financial, technical and marketing resources than we do, which may enable them to:
|
|
• |
develop and expand their infrastructure and service offerings more quickly and achieve greater cost efficiencies; |
|
|
• |
invest in new technologies; |
|
|
• |
expand operations into new markets more rapidly; |
|
|
• |
devote greater resources to marketing; |
|
|
• |
compete for acquisitions more effectively and complete acquisitions more easily; and |
|
|
• |
aggressively price products and services and increase benefits in ways that we may not be able to match financially. |
In order to compete effectively in our markets, we must target our potential clients carefully, continue to improve our efficiencies and the scope and quality of our services, and rely on our service quality, innovation, education and program clarity. If our competitive advantages are not compelling or sustainable, then we are unlikely to increase or sustain profits and our stock price could decline.
Our investment portfolio is subject to market and credit risks, which could adversely impact our financial condition or results of operations.
We seek to hold a diversified portfolio of high-quality investments that is managed by a professional investment advisory firm in accordance with our investment policy and routinely reviewed by management and approved by the risk management committee of our Board of Directors. However, our investments are subject to general economic conditions and market risks, as well as risks inherent to particular securities, including credit, interest rate and liquidity risks. Our portfolio consists primarily of debt securities and is subject to the risk that certain investments may default or become impaired due to deterioration in the financial condition of one or more issuers of the securities. Although our investment strategy is designed to preserve our capital, we cannot be certain that our investment objectives will be achieved, and we could incur substantial realized and unrealized investment losses in future periods.
We may be unable to draw on our revolving credit facility in the future.
If our business does not perform as expected, including if we generate less revenue than anticipated from our operations or encounter significant unexpected costs, we may fail to comply with the financial covenants under our credit facilities. If we do not comply with our financial covenants and we do not obtain a waiver or amendment from our lender, the lender may elect to cause all amounts owed to become immediately due and payable or may decline to renew our credit facility. In that event, we would seek to establish a replacement credit facility with one or more other lenders, including lenders with which we have an existing relationship, potentially on less desirable terms. There can be no guarantee that replacement financing would be available at commercially reasonable terms, if at all.
Changes in our income tax positions or adverse outcomes resulting from on-going or future tax audits could harm our business, operating results, financial condition and prospects.
Significant judgments and estimates are required in determining our provision for income taxes and other tax liabilities. In determining the adequacy of our tax provision, we assess the likelihood of adverse outcomes that could result if our tax positions were challenged by the IRS and other tax authorities. The tax authorities in the U.S. regularly examine our income and other tax returns. The ultimate outcome of tax examinations and disputes cannot be predicted with certainty. Should the IRS or other tax authorities assess additional taxes as a result of these or other examinations, we may be required to record charges to operations that could have a material impact on our results of operations, financial position or cash flows.
16
Risks Related to Our Regulatory Environment
We operate in a complex regulatory environment, and failure to comply with applicable laws and regulations could adversely affect our business.
Corporate human resource operations are subject to a broad range of complex and evolving laws and regulations, including those applicable to payroll practices, benefits administration, employment practices, workers’ compensation coverage, and privacy. Because our clients have employees in many states throughout the United States, we must perform our services in compliance with the legal and regulatory requirements of multiple jurisdictions. Some of these laws and regulations may be difficult to ascertain or interpret and may change from time to time. Violation of such laws and regulations could subject us to fines and penalties, damage our reputation, constitute a breach of our client agreements, impair our ability to obtain and renew required licenses, and decrease our profitability or competitiveness. If any of these effects were to occur, our operating results and financial condition could be adversely affected.
If we are determined not to be an “employer” under certain laws and regulations, our clients may stop using our services, and we may be subject to additional liabilities.
We are the administrative employer in our co-employment relationships under the various laws and regulations of the IRS and the U.S. Department of Labor. If we are determined not to be the administrative employer under such laws and regulations and are therefore unable to assume our clients’ obligations for employment and other taxes, our clients may be held jointly and severally liable for payment of such taxes. Some clients or prospective clients may view such potential liability as an unacceptable risk, discouraging current clients from continuing a relationship with us or prospective clients from entering into a new relationship with us. Any determination that we are not the administrative employer for purposes of ERISA could also adversely affect our cafeteria benefits plan operated under Section 125 of the Internal Revenue Code and result in liabilities to us under the plan.
Changes in government regulations may result in restrictions or prohibitions applicable to the provision of employment services or the imposition of additional licensing, regulatory or tax requirements.
Our business is heavily regulated in most jurisdictions in which we operate. We cannot provide assurance that the states in which we conduct or seek to conduct business will not:
|
|
• |
impose additional regulations that prohibit or restrict employment-related businesses like ours; |
|
|
• |
require additional licensing or add restrictions on existing licenses to provide employment-related services; or |
|
|
• |
increase taxes or make changes in the way in which taxes are calculated for providers of employment-related services. |
Any changes in applicable laws and regulations may make it more difficult or expensive for us to do business, inhibit expansion of our business, or result in additional expenses that limit our profitability or decrease our ability to attract and retain clients.
17
We may find it difficult to expand our business into additional states due to varying state regulatory requirements.
Future growth in our operations depends, in part, on our ability to offer our services to prospective clients in new states, which may subject us to different regulatory requirements and standards. In order to operate effectively in a new state, we must obtain all necessary regulatory approvals, adapt our procedures to that state's regulatory requirements and modify our service offerings to adapt to local market conditions. As we expand into additional states, we may not be able to duplicate in other markets the financial performance experienced in our current markets.
Our wholly owned insurance companies are subject to substantial government regulation.
Our wholly owned insurance companies are primarily regulated by state insurance commissioners in the states in which they conduct business. Such regulation includes monitoring the financial status of these companies, approving policies and premium rates, maintaining requirements for capital surplus and types of investments, and approving any significant changes to the legal or operating structure of these entities. State regulators can also impose taxes and other fees on insurance companies under their jurisdiction. These regulations may restrict our ability to operate these companies in the manner we believe is best, which could increase the cost of our operations, restrict our access to insurance coverage or adversely affect our liquidity.
Risks Related to Ownership of our Common Stock
Our stock price may be volatile or may decline, resulting in substantial losses for our stockholders.
The market price of our Common Stock has been, and may continue to be, volatile for the foreseeable future. Important factors that may cause our trading price to decline include the factors listed below and other factors that may have a material adverse effect on our business or financial results, including those described above in this “Risk Factors” section:
|
|
• |
actual or anticipated fluctuations in our results of operations, including a significant slowdown in our revenue growth or material increase in our workers’ compensation expense; |
|
|
• |
our failure to maintain effective internal control over financial reporting or otherwise discover material errors in our financial reporting; |
|
|
• |
imposition of significant fines or penalties or other adverse action by regulatory authorities against the Company; |
|
|
• |
adverse developments in legal proceedings involving claims against the Company; |
|
|
• |
our failure to meet financial projections or achieve financial results anticipated by analysts; or |
|
|
• |
changes in our Board of Directors or management. |
18
Maryland law and our Charter and bylaws contain provisions that could make the takeover of the Company more difficult.
Certain provisions of Maryland law and our Charter and bylaws could have the effect of delaying or preventing a third party from acquiring the Company, even if a change in control would be beneficial to our stockholders. These provisions of our Charter and bylaws permit the Board of Directors to issue up to 500,000 shares of preferred stock with such rights and preferences, including voting rights, as the Board may establish, without further approval by the Company's stockholders, which could also adversely affect the voting power of holders of our Common Stock.
In addition, the Company is subject to the Maryland control share act (the “Control Share Act”). Under the Control Share Act, a person (an “Acquiring Person”) who acquires voting stock in a transaction (a “Control Share Acquisition”) which results in its holding voting power within specified ranges cannot vote the shares it acquires in the Control Share Acquisition unless voting rights are accorded to such control shares by the holders of two-thirds of the outstanding voting shares, excluding the Acquiring Person and the Company's officers and directors who are also employees of the Company.
The Company is also subject to the provisions of Maryland law limiting the ability of certain Maryland corporations to engage in specified business combinations (the “Business Combination Act”). Subject to certain exceptions, the Business Combination Act prohibits a Maryland corporation from engaging in a business combination with a stockholder who, with its affiliates, owns 10% or more of the corporation's voting stock. These provisions will not apply to business combinations that are approved by the Board of Directors before the stockholder became an interested stockholder.
|
Item 1B |
UNRESOLVED STAFF COMMENTS |
None.
19
|
Item 2. |
PROPERTIES |
We operate through 56 branch offices. The following table shows the number of locations in each state in which we have offices. We also lease office space in other locations in our market areas which we use to recruit and place employees.
|
|
|
Number of Branch |
|
Offices |
|
Locations |
|
California |
|
26 |
|
Oregon |
|
5 |
|
Arizona |
|
3 |
|
Colorado |
|
3 |
|
Idaho |
|
3 |
|
Utah |
|
3 |
|
Washington |
|
3 |
|
Maryland |
|
2 |
|
Nevada |
|
2 |
|
Pennsylvania |
|
2 |
|
Delaware |
|
1 |
|
North Carolina |
|
1 |
|
New Mexico |
|
1 |
|
Virginia |
|
1 |
|
|
|
|
We lease office space for our branch offices. At December 31, 2020, our leases had expiration dates ranging from less than one year to seven years. Our corporate headquarters occupies approximately 73 percent of the 65,300 square foot building we own in Vancouver, Washington.
20
|
Item 3. |
LEGAL PROCEEDINGS |
BBSI is not subject to material legal proceedings and claims other than those which arise in the ordinary course of our business, except for those matters discussed in “Note 12 - Litigation” to the consolidated financial statements incorporated into Item 8 of Part II of this report.
|
Item 4. |
MINE SAFETY DISCLOSURES |
Not Applicable
PART II
|
Item 5. |
MARKET FOR REGISTRANT'S COMMON EQUITY, RELATED STOCKHOLDER MATTERS AND ISSUER PURCHASES OF EQUITY SECURITIES |
Our common stock (the "Common Stock") trades on the Global Select Market segment of The Nasdaq Stock Market under the symbol "BBSI." At February 10, 2021, there were 26 stockholders of record and approximately 5,171 beneficial owners of the Common Stock.
The following table summarizes information related to stock repurchases during the quarter ended December 31, 2020.
|
|
|
Total |
|
|
|
|
|
|
Total Number of |
|
|
Approximate Dollar Value of |
|
|||
|
|
|
Number of |
|
|
Average Price |
|
|
Shares Repurchased |
|
|
Shares that May Yet |
|
||||
|
|
|
Shares |
|
|
Paid |
|
|
as Part of Publicly |
|
|
Be Repurchased |
|
||||
|
Month |
|
Repurchased |
|
|
Per Share |
|
|
Announced Plan (1) |
|
|
Under the Plan (1) |
|
||||
|
October |
|
|
57,018 |
|
|
$ |
53.61 |
|
|
|
57,018 |
|
|
$ |
43,955,953 |
|
|
November |
|
|
— |
|
|
|
— |
|
|
|
— |
|
|
|
43,955,953 |
|
|
December |
|
|
28,000 |
|
|
|
71.80 |
|
|
|
28,000 |
|
|
|
41,945,651 |
|
|
Total |
|
|
85,018 |
|
|
|
|
|
|
|
85,018 |
|
|
|
|
|
(1) In August 2019, the Board had authorized the repurchase of up to $50.0 million of shares of the Company’s stock from time to time in open market purchases over a three-year period beginning August 15, 2019. As of December 31, 2020, the Company had repurchased 144,470 shares at an aggregate purchase price of $8.1 million.
21
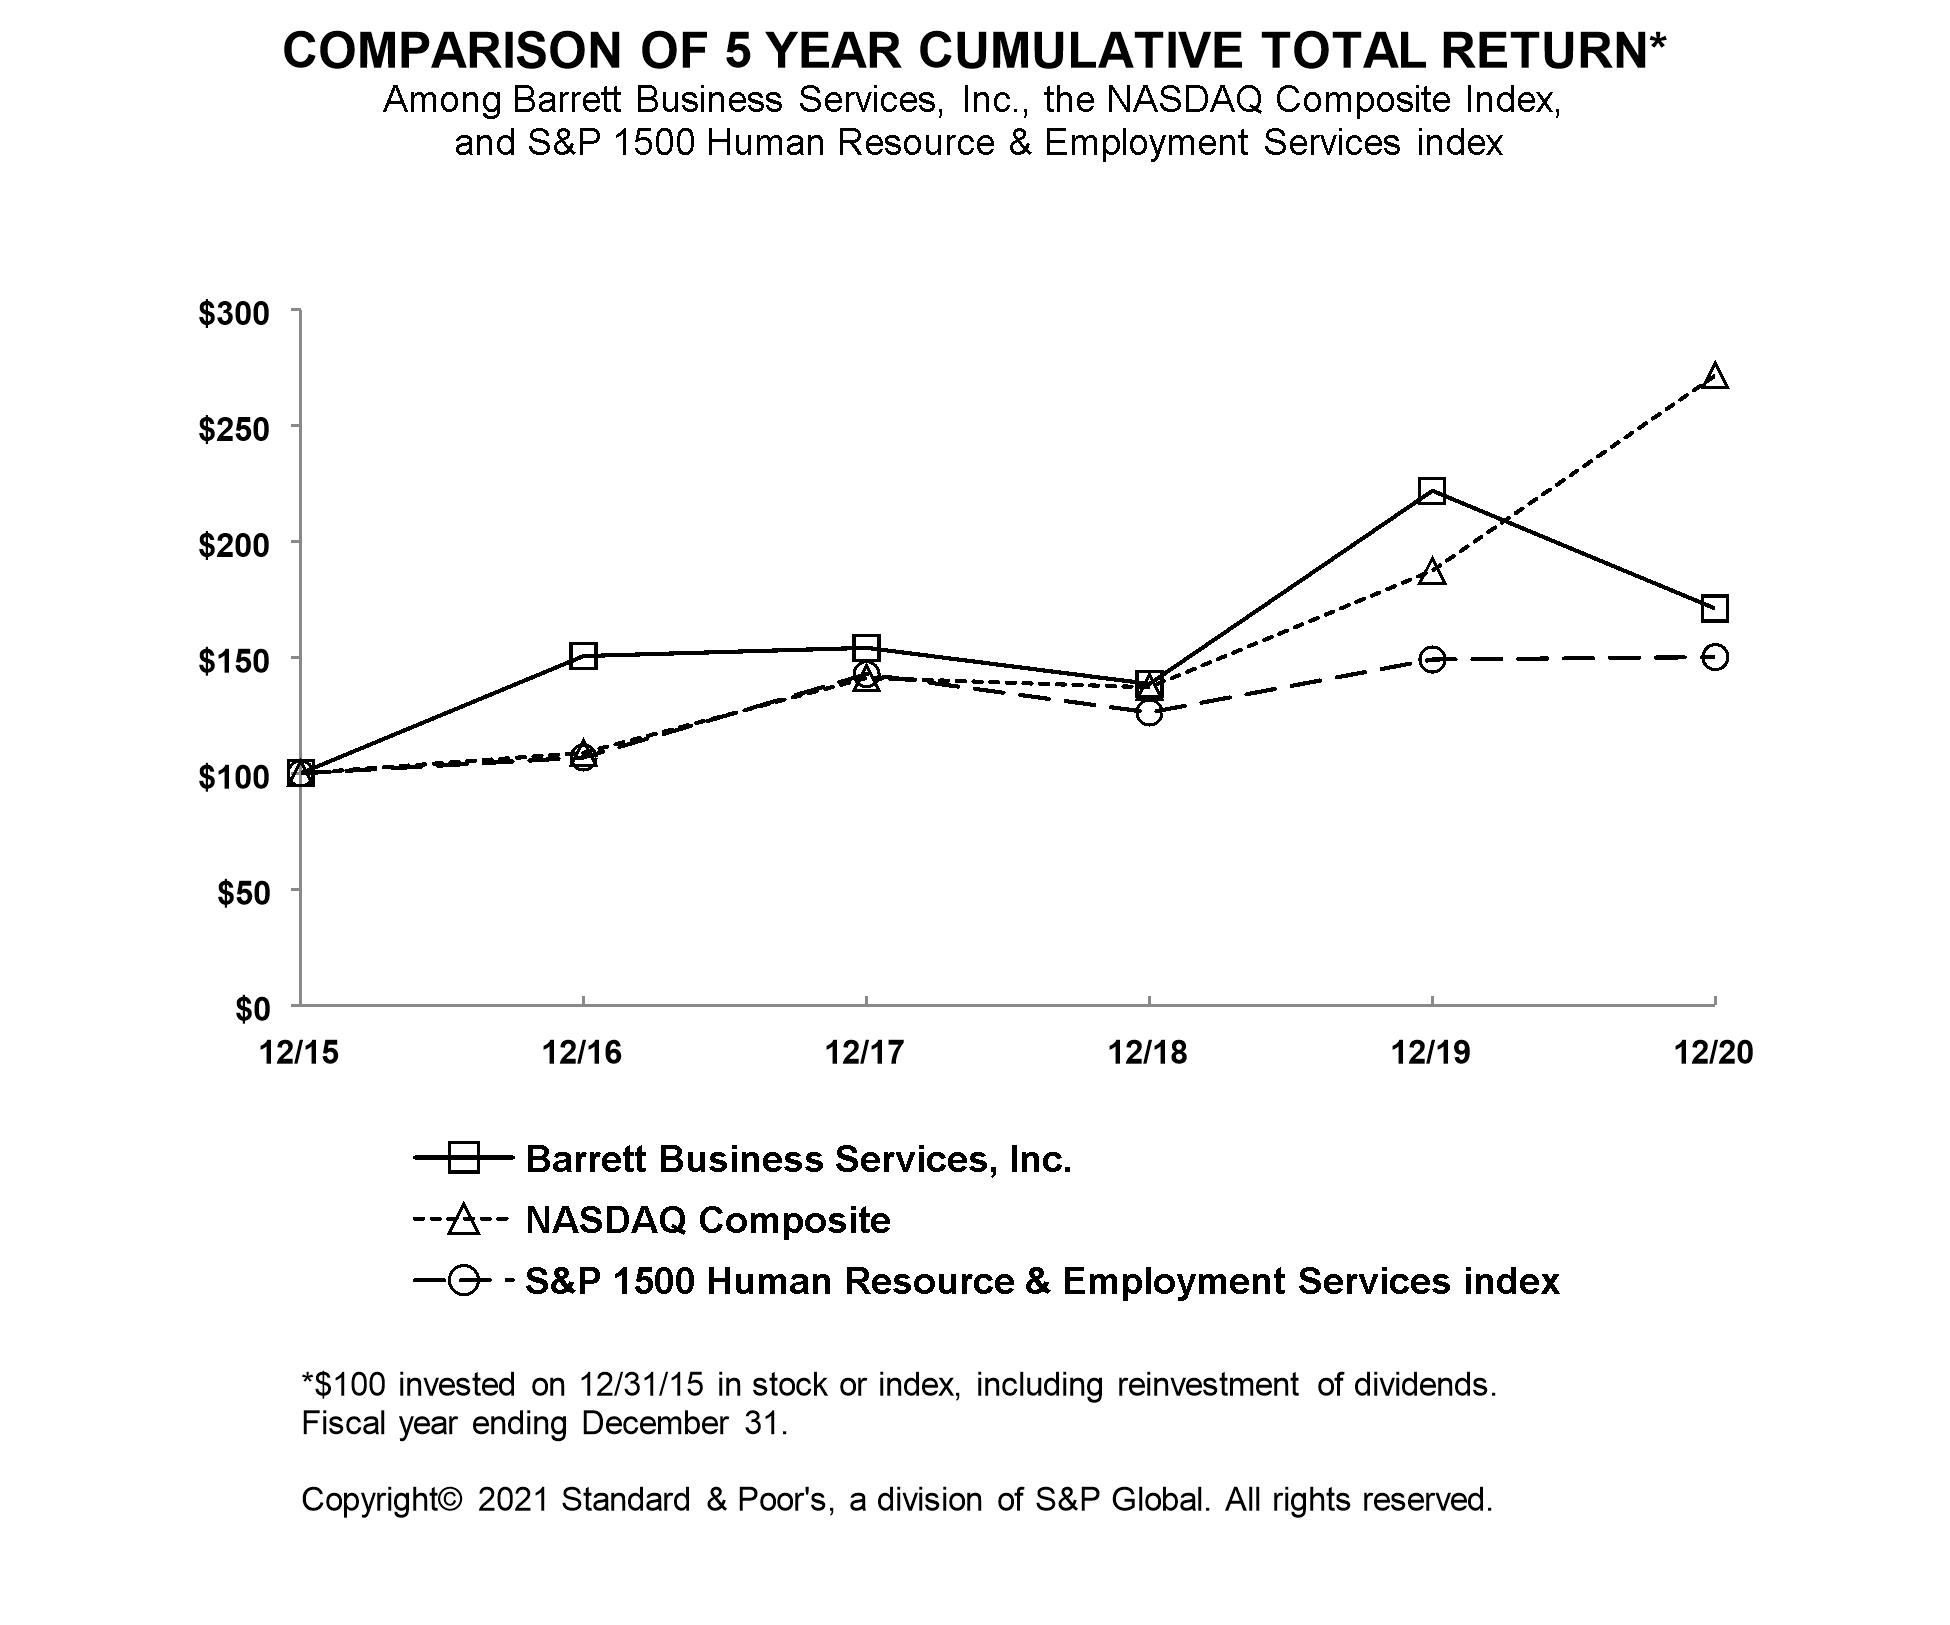
The following graph shows the cumulative total return at the dates indicated for the period from December 31, 2015 until December 31, 2020, for our Common Stock, The Nasdaq Composite Index, and the S&P 1500 Human Resource & Employment Services Index, a published industry index that is considered reflective of the Company’s peers.
The stock performance graph has been prepared assuming that $100 was invested on December 31, 2015 in our Common Stock and the indexes shown, and that dividends are reinvested. The stock price performance reflected in the graph may not be indicative of future price performance.
|
|
|
12/15 |
|
12/16 |
|
12/17 |
|
12/18 |
|
12/19 |
|
12/20 |
|
||||||
|
|
|
|
|
|
|
|
|
|
|
|
|
|
|
|
|
|
|
|
|
|
Barrett Business Services, Inc. |
|
|
100.00 |
|
|
150.60 |
|
|
154.15 |
|
|
138.60 |
|
|
221.90 |
|
|
171.08 |
|
|
NASDAQ Composite |
|
|
100.00 |
|
|
108.87 |
|
|
141.13 |
|
|
137.12 |
|
|
187.44 |
|
|
271.64 |
|
|
S&P 1500 Human Resource & Employment Services index |
|
|
100.00 |
|
|
106.87 |
|
|
142.78 |
|
|
126.28 |
|
|
149.13 |
|
|
150.17 |
|
22
|
Item 6. |
SELECTED CONSOLIDATED FINANCIAL DATA |
The following selected consolidated financial data should be read in conjunction with the Company's consolidated financial statements and the accompanying notes in Item 8 of Part II, “Financial Statements and Supplementary Data,” and the information contained in Item 7 of Part II, “Management’s Discussion and Analysis of Financial Condition and Results of Operations.” Historical results are not necessarily indicative of future results.
|
|
|
Year Ended December 31, |
|
|||||||||||||||||
|
|
|
2020 |
|
|
2019 |
|
|
2018 |
|
|
2017 |
|
|
2016 |
|
|||||
|
(In thousands, except per share data) |
|
|
|
|
|
|
|
|
|
|
|
|
|
|
|
|
|
|
|
|
|
Statement of operations: |
|
|
|
|
|
|
|
|
|
|
|
|
|
|
|
|
|
|
|
|
|
Revenues: |
|
|
|
|
|
|
|
|
|
|
|
|
|
|
|
|
|
|
|
|
|
Professional employer service fees |
|
$ |
777,430 |
|
|
$ |
819,873 |
|
|
$ |
793,399 |
|
|
$ |
758,046 |
|
|
$ |
673,924 |
|
|
Staffing services |
|
$ |
103,394 |
|
|
|
122,438 |
|
|
|
147,299 |
|
|
|
162,386 |
|
|
|
166,662 |
|
|
Total revenues |
|
|
880,824 |
|
|
|
942,311 |
|
|
|
940,698 |
|
|
|
920,432 |
|
|
|
840,586 |
|
|
Cost of revenues: |
|
|
|
|
|
|
|
|
|
|
|
|
|
|
|
|
|
|
|
|
|
Direct payroll costs |
|
|
78,380 |
|
|
|
92,455 |
|
|
|
111,443 |
|
|
|
122,533 |
|
|
|
126,753 |
|
|
Payroll taxes and benefits |
|
|
418,793 |
|
|
|
429,713 |
|
|
|
407,003 |
|
|
|
404,687 |
|
|
|
357,867 |
|
|
Workers' compensation |
|
|
200,744 |
|
|
|
211,890 |
|
|
|
235,579 |
|
|
|
234,681 |
|
|
|
210,430 |
|
|
Total cost of revenues |
|
|
697,917 |
|
|
|
734,058 |
|
|
|
754,025 |
|
|
|
761,901 |
|
|
|
695,050 |
|
|
Gross margin |
|
|
182,907 |
|
|
|
208,253 |
|
|
|
186,673 |
|
|
|
158,531 |
|
|
|
145,536 |
|
|
Selling, general and administrative expenses |
|
|
141,916 |
|
|
|
153,879 |
|
|
|
145,465 |
|
|
|
123,138 |
|
|
|
113,342 |
|
|
Depreciation and amortization |
|
|
4,844 |
|
|
|
3,886 |
|
|
|
4,219 |
|
|
|
5,452 |
|
|
|
3,253 |
|
|
Income from operations |
|
|
36,147 |
|
|
|
50,488 |
|
|
|
36,989 |
|
|
|
29,941 |
|
|
|
28,941 |
|
|
Other income (expense): |
|
|
|
|
|
|
|
|
|
|
|
|
|
|
|
|
|
|
|
|
|
Investment income, net |
|
|
7,977 |
|
|
|
12,520 |
|
|
|
9,077 |
|
|
|
4,668 |
|
|
|
956 |
|
|
Interest expense |
|
|
(1,244 |
) |
|
|
(1,789 |
) |
|
|
(1,052 |
) |
|
|
(313 |
) |
|
|
(807 |
) |
|
Loss on litigation |
|
— |
|
|
— |
|
|
— |
|
|
— |
|
|
|
(3,544 |
) |
||||
|
Other, net |
|
|
(284 |
) |
|
|
(81 |
) |
|
|
(245 |
) |
|
|
82 |
|
|
|
40 |
|
|
Other income (expense), net |
|
|
6,449 |
|
|
|
10,650 |
|
|
|
7,780 |
|
|
|
4,437 |
|
|
|
(3,355 |
) |
|
Income before income taxes |
|
|
42,596 |
|
|
|
61,138 |
|
|
|
44,769 |
|
|
|
34,378 |
|
|
|
25,586 |
|
|
Provision for income taxes |
|
|
8,831 |
|
|
|
12,846 |
|
|
|
6,707 |
|
|
|
9,208 |
|
|
|
6,787 |
|
|
Net income |
|
$ |
33,765 |
|
|
$ |
48,292 |
|
|
$ |
38,062 |
|
|
$ |
25,170 |
|
|
$ |
18,799 |
|
|
Basic income per common share |
|
$ |
4.46 |
|
|
$ |
6.48 |
|
|
$ |
5.18 |
|
|
$ |
3.46 |
|
|
$ |
2.60 |
|
|
Weighted average number of basic common shares outstanding |
|
|
7,577 |
|
|
|
7,451 |
|
|
|
7,342 |
|
|
|
7,275 |
|
|
|
7,226 |
|
|
Diluted income per common share |
|
$ |
4.39 |
|
|
$ |
6.27 |
|
|
$ |
4.98 |
|
|
$ |
3.33 |
|
|
$ |
2.55 |
|
|
Weighted average number of diluted common shares outstanding |
|
|
7,688 |
|
|
|
7,699 |
|
|
|
7,647 |
|
|
|
7,551 |
|
|
|
7,378 |
|
|
Cash dividends per common share |
|
$ |
1.20 |
|
|
$ |
1.10 |
|
|
$ |
1.00 |
|
|
$ |
1.00 |
|
|
$ |
0.88 |
|
|
Selected balance sheet data: |
|
|
|
|
|
|
|
|
|
|
|
|
|
|
|
|
|
|
|
|
|
Cash and cash equivalents |
|
$ |
68,688 |
|
|
$ |
44,570 |
|
|
$ |
35,371 |
|
|
$ |
59,835 |
|
|
$ |
50,768 |
|
|
Investments |
|
|
101,244 |
|
|
|
82,590 |
|
|
|
2,103 |
|
|
|
1,873 |
|
|
|
6,317 |
|
|
Current assets |
|
|
407,875 |
|
|
|
423,848 |
|
|
|
321,673 |
|
|
|
308,235 |
|
|
|
235,383 |
|
|
Current liabilities |
|
|
290,637 |
|
|
|
342,122 |
|
|
|
326,738 |
|
|
|
322,255 |
|
|
|
275,164 |
|
|
Working capital surplus (deficit) |
|
|
117,238 |
|
|
|
81,726 |
|
|
|
(5,065 |
) |
|
|
(14,020 |
) |
|
|
(39,781 |
) |
|
Total assets |
|
|
774,950 |
|
|
|
860,929 |
|
|
|
756,089 |
|
|
|
682,485 |
|
|
|
581,888 |
|
|
Long-term workers' compensation liabilities |
|
|
255,706 |
|
|
|
320,713 |
|
|
|
304,078 |
|
|
|
265,844 |
|
|
|
231,198 |
|
|
Long-term debt, net of current portion |
|
|
3,510 |
|
|
|
3,730 |
|
|
|
3,951 |
|
|
|
4,171 |
|
|
|
4,392 |
|
|
Stockholders' equity |
|
|
198,235 |
|
|
|
171,799 |
|
|
|
119,037 |
|
|
|
88,834 |
|
|
|
69,693 |
|
23
|
Item 7. |
MANAGEMENT'S DISCUSSION AND ANALYSIS OF FINANCIAL CONDITION AND RESULTS OF OPERATIONS |
Overview
The Company is a leading provider of business management solutions for small and mid-sized companies. The Company has developed a management platform that integrates a knowledge-based approach from the management consulting industry with tools from the human resource outsourcing industry. This platform, through the effective leveraging of human capital, helps our business owner clients run their businesses more effectively. We believe this platform, delivered through a decentralized organizational structure, differentiates BBSI from our competitors.
We report revenues in our financial results in two categories of services: professional employer services (“PEO”) and staffing.
With our PEO clients, we enter into a co-employment arrangement in which we become the administrative employer while the client maintains physical care, custody and control of their workforce. Our PEO services are billed as a percentage of client payroll, with the gross amount invoiced including direct payroll costs, employer payroll-related taxes, workers’ compensation coverage (if provided) and a service fee. PEO customers are invoiced following the end of each payroll processing cycle, with payment generally due on the invoice date. Revenues for PEO services exclude direct payroll billings because we are not the primary obligor for those payments.
We generate staffing services revenues primarily from short-term staffing, contract staffing, on-site management and direct placement services. For staffing services other than direct placement, invoiced amounts include direct payroll, employer payroll-related taxes, workers’ compensation coverage and a service fee. Staffing customers are invoiced weekly and typically have payment terms of 30 days. Direct placement services are billed at agreed fees at the time of a successful placement.
Our business is concentrated in California, and we expect to continue to derive a majority of our revenues from this market in the future. Revenues generated in our California operations accounted for 75% of our total revenues in 2020, 77% in 2019 and 79% in 2018. Consequently, any weakness in economic conditions or changes in the regulatory or insurance environment in California could have a material adverse effect on our financial results.
Our cost of revenues for PEO services includes employer payroll-related taxes and workers' compensation costs. Our cost of revenues for staffing services includes direct payroll costs, employer payroll-related taxes, employee benefits, and workers’ compensation costs. Direct payroll costs represent the gross payroll earned by staffing services employees based on salary or hourly wages. Payroll taxes and employee benefits consist of the employer's portion of Social Security and Medicare taxes, federal and state unemployment taxes and staffing services employee reimbursements for materials, supplies and other expenses, which are paid by our customer. Workers' compensation costs consist primarily of the costs associated with our workers' compensation program, including claims reserves, claims administration fees, legal fees, medical cost containment (“MCC”) expense, state administrative agency fees, third-party broker commissions, risk manager payroll, premiums for excess insurance and the fronted insurance program, and costs associated with operating our two wholly owned insurance companies, AICE and Ecole.
Selling, general and administrative expenses represent both branch office and corporate-level operating expenses. Branch operating expenses consist primarily of branch office staff payroll and personnel related costs, advertising, rent, office supplies, professional and legal fees and branch incentive compensation. Corporate-level operating expenses consist primarily of executive and office staff payroll and personnel related costs, professional and legal fees, travel, occupancy costs, information systems costs, and executive and corporate staff incentive compensation.
24
Depreciation and amortization represent depreciation of property and equipment, leasehold improvements, software and internally developed software costs. Property, equipment, software and internally developed software costs are depreciated using the straight-line method over their estimated useful lives, which range from 3 to 39 years. Leasehold improvements are amortized using the straight-line method over the shorter of the lease term or estimated useful life.
Critical Accounting Policies and Estimates
We have identified the following accounting estimate as critical to our business and the understanding of our results of operations. For a detailed discussion of the application of this and other accounting policies, see “Note 1 - Summary of Operations and Significant Accounting Policies” to the consolidated financial statements in Item 8 of Part II of this report. The preparation of this Annual Report on Form 10-K requires management to make estimates and assumptions that affect the reported amounts of assets and liabilities at the date of the financial statements, and the reported amounts of revenue and expenses during the reporting period. Management bases its estimates on historical experience and on various other assumptions that are believed to be reasonable under the circumstances, the results of which form the basis for making judgments about the carrying values of assets and liabilities that are not readily apparent from other sources. Actual results may differ from these estimates.
Workers' Compensation Reserves
We recognize our liability for the ultimate payment of incurred claims and claims adjustment expenses by establishing a reserve which represents our estimates of future amounts necessary to pay claims and related expenses with respect to workplace injuries that have occurred. When a claim involving a probable loss is reported, our independent third-party administrator for workers’ compensation claims (“TPA”) establishes a case reserve for the estimated amount of ultimate loss. The estimate reflects a judgment based on established case reserving practices and the experience and knowledge of the TPA regarding the nature and expected amount of the claim, as well as the estimated expenses of settling the claim, including legal and other fees and expenses of claims administration. The adequacy of such case reserves in part depends on the professional judgment of the TPA to properly and comprehensively evaluate the economic consequences of each claim.
Our reserves include an additional component for potential future increases in the cost to finally resolve open injury claims and claims incurred in prior periods but not reported (together, "IBNR") based on actuarial estimates provided by the Company’s independent actuary. IBNR reserves, unlike specific case reserves, do not apply to a specific claim but rather apply to the entire population of claims arising from a specific time period. IBNR primarily covers costs relating to:
|
|
• |
Future claim payments in excess of case reserves on recorded open claims; |
|
|
• |
Additional claim payments on closed claims; and |
|
|
• |
Claims that have occurred but have not yet been reported to us. |
The process of estimating unpaid claims and claims adjustment expense involves a high degree of judgment and is affected by both internal and external events, including changes in claims handling practices, modifications in reserve estimation procedures, changes in individuals involved in the reserve estimation process, inflation, trends in the litigation and settlement of pending claims, and legislative changes.
Our estimates are based on informed judgment, derived from individual experiences and expertise applied to multiple sets of data and analyses. We consider significant facts and circumstances known both at the time that loss reserves are initially established and as new facts and circumstances become known. Due to the inherent uncertainty underlying loss reserve estimates, the expenses incurred through final resolution of our liability for our workers’ compensation claims will likely vary from the related loss reserves at the reporting date. Therefore, as specific claims are paid out in the future, actual paid losses may be materially different from our current loss reserves.
25
A basic premise in most actuarial analyses is that historical data and past patterns demonstrated in the incurred and paid historical data form a reasonable basis upon which to project future outcomes, absent a material change. Significant structural changes to the available data can materially impact the reserve estimation process. To the extent a material change affecting the ultimate claim liability becomes known, such change is quantified to the extent possible through an analysis of internal company data and, if available and when appropriate, external data. Actuaries exercise a considerable degree of judgment in the evaluation of these factors and the need for such actuarial judgment is more pronounced when faced with material uncertainties.
We believe that the amounts recorded for our estimated liabilities for workers’ compensation claims, which are based on informed judgment, analysis of data, actuarial estimates, and analysis of other trends associated with the Company’s historical universe of claims data, are reasonable. Nevertheless, adjustments to such estimates will be required in future periods if the development of claim costs varies materially from our estimates and such future adjustments may be material to our results of operations.
Recent Accounting Pronouncements
For a discussion of recent accounting pronouncements and their potential effect on the Company's results of operations and financial condition, see “Note 1 - Summary of Operations and Significant Accounting Policies” to the consolidated financial statements in Item 8 of Part II of this report.
Forward-Looking Information
Statements in this Item or in Items 1, 1A, 3 and 9A of this report include forward-looking statements which are not historical in nature and are forward-looking statements within the meaning of the Private Securities Litigation Reform Act of 1995. These forward-looking statements include, among others, discussion of economic conditions in our market areas and their effect on revenue levels, the effects of the COVID-19 pandemic on our business operations, the competitiveness of our service offerings, our ability to attract and retain clients and to achieve revenue growth, the effect of changes in our mix of services on gross margin, the effect of tight labor market conditions, the adequacy of our workers' compensation reserves, the effect of changes in estimates of our future claims liabilities on our workers’ compensation reserves, including the effect of changes in our reserving practices and claims management process on our actuarial estimates, expected levels of required surety deposits and letters of credit, our ability to generate sufficient taxable income in the future to utilize our deferred tax assets, the effect of our formation and operation of two wholly owned licensed insurance subsidiaries, the risks of operation and cost of our fronted insurance program with Chubb, the financial viability of our excess insurance carriers, the effectiveness of our management information systems, our relationship with our primary bank lender and the availability of financing and working capital to meet our funding requirements, litigation costs, the effect of changes in the interest rate environment on the value of our investment securities and long-term debt, the adequacy of our allowance for doubtful accounts, and the potential for and effect of acquisitions.
26
All of our forward-looking statements involve known and unknown risks, uncertainties and other factors that may cause the actual results, performance or achievements of the Company or industry to be materially different from any future results, performance or achievements expressed or implied by such forward-looking statements. Such factors with respect to the Company include our ability to retain current clients and attract new clients, the effects of governmental orders imposing business closures and shelter-in-place and social distancing requirements, difficulties associated with integrating clients into our operations, economic trends in our service areas, the potential for material deviations from expected future workers’ compensation claims experience, changes in the workers’ compensation regulatory environment in our primary markets, security breaches or failures in the Company’s information technology systems, collectability of accounts receivable, changes in effective payroll tax rates and federal and state income tax rates, the carrying values of deferred income tax assets and goodwill (which may be affected by our future operating results), the impact of and potential changes to the Patient Protection and Affordable Care Act, escalating medical costs, and other health care legislative initiatives on our business, the effect of conditions in the global capital markets on our investment portfolio, and the availability of capital, borrowing capacity on our revolving credit facility, or letters of credit necessary to meet state-mandated surety deposit requirements for maintaining our status as a qualified self-insured employer for workers' compensation coverage or our fronted insurance program. Additional risk factors affecting our business are discussed in Item 1A of Part I of this report. We disclaim any obligation to publicly announce any revisions to any of the forward-looking statements contained herein to reflect future events or developments.
Results of Operations
The spread of COVID-19 and resulting shelter-in-place and similar restrictions across the United States are having, and will continue to have, a negative impact on the operating results of the Company. As our clients respond to the effects of efforts to address the consequences of the pandemic, including the measures taken at various levels of government to contain the virus’s spread, we expect that our ability to add new customers, as well as to grow revenues from existing customers, will be adversely affected due to economic slowdown, business closures, furloughs, hiring freezes and reductions in hours worked.
The following table sets forth the percentages of total revenues represented by selected items in the Company's consolidated statements of operations for the years ended December 31, 2020, 2019 and 2018, included in Item 8 of Part II of this report.
|
|
|
Percentage of Total Net Revenues |
|
|
|||||||||||||||||||||||
|
($ in thousands) |
|
Years Ended December 31, |
|
|
|||||||||||||||||||||||
|
|
|
2020 |
|
|
|
2019 |
|
|
|
2018 |
|
|
|||||||||||||||
|
Revenues: |
|
|
|
|
|
|
|
|
|
|
|
|
|
|
|
|
|
|
|
|
|
|
|
|
|
|
|
|
Professional employer service fees |
|
$ |
777,430 |
|
|
|
88.3 |
|
% |
|
$ |
819,873 |
|
|
|
87.0 |
|
% |
|
$ |
793,399 |
|
|
|
84.3 |
|
% |
|
Staffing services |
|
|
103,394 |
|
|
|
11.7 |
|
|
|
|
122,438 |
|
|
|
13.0 |
|
|
|
$ |
147,299 |
|
|
|
15.7 |
|
|
|
Total revenues |
|
|
880,824 |
|
|
|
100.0 |
|
|
|
|
942,311 |
|
|
|
100.0 |
|
|
|
|
940,698 |
|
|
|
100.0 |
|
|
|
Cost of revenues: |
|
|
|
|
|
|
|
|
|
|
|
|
|
|
|
|
|
|
|
|
|
|
|
|
|
|
|
|
Direct payroll costs |
|
|
78,380 |
|
|
|
8.9 |
|
|
|
|
92,455 |
|
|
|
9.8 |
|
|
|
|
111,443 |
|
|
|
11.8 |
|
|
|
Payroll taxes and benefits |
|
|
418,793 |
|
|
|
47.5 |
|
|
|
|
429,713 |
|
|
|
45.6 |
|
|
|
|
407,003 |
|
|
|
43.3 |
|
|
|
Workers’ compensation |
|
|
200,744 |
|
|
|
22.8 |
|
|
|
|
211,890 |
|
|
|
22.5 |
|
|
|
|
235,579 |
|
|
|
25.1 |
|
|
|
Total cost of revenues |
|
|
697,917 |
|
|
|
79.2 |
|
|
|
|
734,058 |
|
|
|
77.9 |
|
|
|
|
754,025 |
|
|
|
80.2 |
|
|
|
Gross margin |
|
|
182,907 |
|
|
|
20.8 |
|
|
|
|
208,253 |
|
|
|
22.1 |
|
|
|
|
186,673 |
|
|
|
19.8 |
|
|
|
Selling, general and administrative expenses |
|
|
141,916 |
|
|
|
16.1 |
|
|
|
|
153,879 |
|
|
|
16.3 |
|
|
|
|
145,465 |
|
|
|
15.5 |
|
|
|
Depreciation and amortization |
|
|
4,844 |
|
|
|
0.6 |
|
|
|
|
3,886 |
|
|
|
0.4 |
|
|
|
|
4,219 |
|
|
|
0.4 |
|
|
|
Income from operations |
|
|
36,147 |
|
|
|
4.1 |
|
|
|
|
50,488 |
|
|
|
5.4 |
|
|
|
|
36,989 |
|
|
|
3.9 |
|
|
|
Other income, net |
|
|
6,449 |
|
|
|
0.7 |
|
|
|
|
10,650 |
|
|
|
1.1 |
|
|
|
|
7,780 |
|
|
|
0.8 |
|
|
|
Income before income taxes |
|
|
42,596 |
|
|
|
4.8 |
|
|
|
|
61,138 |
|
|
|
6.5 |
|
|
|
|
44,769 |
|
|
|
4.7 |
|
|
|
Provision for income taxes |
|
|
8,831 |
|
|
|
1.0 |
|
|
|
|
12,846 |
|
|
|
1.4 |
|
|
|
|
6,707 |
|
|
|
0.7 |
|
|
|
Net income |
|
$ |
33,765 |
|
|
|
3.8 |
|
% |
|
$ |
48,292 |
|
|
|
5.2 |
|
% |
|
$ |
38,062 |
|
|
|
4.0 |
|
% |
27
We report PEO revenues net of direct payroll costs because we are not the primary obligor for wage payments to our clients’ employees. However, management believes that gross billings and wages are useful in understanding the volume of our business activity and serve as an important performance metric in managing our operations, including the preparation of internal operating forecasts and establishing executive compensation performance goals. We therefore present for purposes of analysis gross billings and wage information for the years ended December 31, 2020, 2019 and 2018.
|
|
|
Year Ended |
|
|||||||||
|
|
|
December 31, |
|
|||||||||
|
(in thousands) |
|
2020 |
|
|
2019 |
|
|
2018 |
|
|||
|
Gross billings |
|
$ |
5,924,539 |
|
|
$ |
5,971,008 |
|
|
$ |
5,663,095 |
|
|
PEO and staffing wages |
|
|
5,098,604 |
|
|
|
5,090,943 |
|
|
|
4,790,669 |
|
Because safety incentives represent consideration payable to PEO customers, safety incentive costs are netted against PEO revenue in our consolidated statements of operations. We therefore present below for purposes of analysis non-GAAP gross workers’ compensation expense, which represents workers’ compensation costs including safety incentive costs. We believe this non-GAAP measure is useful in evaluating the total costs of our workers’ compensation program.
|
|
|
Year Ended |
|
|||||||||
|
|
|
December 31, |
|
|||||||||
|
(in thousands) |
|
2020 |
|
|
2019 |
|
|
2018 |
|
|||
|
Workers' compensation |
|
$ |
200,744 |
|
|
$ |
211,890 |
|
|
$ |
235,579 |
|
|
Safety incentive costs |
|
|
23,544 |
|
|
|
31,663 |
|
|
|
33,385 |
|
|
Non-GAAP gross workers' compensation |
|
$ |
224,288 |
|
|
$ |
243,553 |
|
|
$ |
268,964 |
|
In monitoring and evaluating the performance of our operations, management also reviews the following ratios, which represent selected amounts as a percentage of gross billings. Management believes these ratios are useful in understanding the efficiency and profitability of our service offerings.
|
|
|
Percentage of Gross Billings |
|
|||||||||
|
|
|
Year Ended |
|
|||||||||
|
|
|
December 31, |
|
|||||||||
|
|
|
2020 |
|
|
2019 |
|
|
2018 |
|
|||
|
PEO and staffing wages |
|
|
86.1 |
% |
|
|
85.3 |
% |
|
|
84.6 |
% |
|
Payroll taxes and benefits |
|
|
7.1 |
% |
|
|
7.2 |
% |
|
|
7.2 |
% |
|
Non-GAAP gross workers' compensation |
|
|
3.8 |
% |
|
|
4.1 |
% |
|
|
4.7 |
% |
|
Gross margin |
|
|
3.1 |
% |
|
|
3.5 |
% |
|
|
3.3 |
% |
The presentation of revenues on a net basis and the relative contributions of staffing and professional employer services revenues can create volatility in our gross margin percentage. A relative increase in professional employer services revenue will result in a higher gross margin percentage. Improvement in gross margin percentage occurs because incremental client services revenue dollars are reported as revenue net of all related direct payroll and safety incentive costs.
28
We refer to employees of our PEO clients as worksite employees (“WSEs”). Management reviews average and ending WSE growth to monitor and evaluate the performance of our operations. Average WSEs are calculated by dividing the number of unique individuals paid in each month by the number of months in the period. Ending WSEs represents the number of unique individuals paid in the last month of the period.
|
|
|
Year Ended |
|
|||||||||||||||||
|
|
|
December 31, |
|
|||||||||||||||||
|
|
|
2020 |
|
|
% Change |
|
|
2019 |
|
|
% Change |
|
|
2018 |
|
|||||
|
Average WSEs |
|
|
108,249 |
|
|
|
-5.3 |
% |
|
|
114,341 |
|
|
|
4.1 |
% |
|
|
109,859 |
|
|
Ending WSEs |
|
|
109,292 |
|
|
|
-4.6 |
% |
|
|
114,584 |
|
|
|
4.6 |
% |
|
|
109,527 |
|
Years Ended December 31, 2020 and 2019
Net income for 2020 was $33.8 million compared to net income of $48.3 million for 2019. Diluted income per share for 2020 was $4.39 compared to diluted income per share of $6.27 for 2019.
Revenues for 2020 totaled $880.8 million, a decrease of $61.5 million or 6.5% over 2019, which reflects a decrease in the Company’s professional employer service fee revenue of $42.4 million or 5.2% and a decrease in staffing services revenue of $19.0 million or 15.6%.
The reduction in PEO services revenues was primarily attributable to the effects of COVID-19 on our clients and our business. Gross billings for PEO services to continuing customers increased 0.3% compared to 2019. Gross billings increased only slightly primarily due to the impacts of COVID-19 during the year, which we expect to continue into future quarters. PEO revenue is presented net of safety incentives of $23.5 million and $31.7 million in 2020 and 2019, respectively. The decrease in staffing services revenue was due primarily to the impacts of COVID-19 during the 2020 period.
Gross margin for 2020 totaled $182.9 million or 20.8% of revenue compared to $208.3 million or 22.1% of revenue for 2019. The decrease in gross margin as a percentage of revenues is a result of increased pricing competitiveness in the year driven by economic and market conditions as well as the factors discussed below within the separate components of gross margin.
Direct payroll costs for 2020 totaled $78.4 million or 8.9% of revenue compared to $92.5 million or 9.8% of revenue for 2019. The decrease in direct payroll costs percentage was primarily due to the increase in professional employer services and the decrease of staffing services within the mix of our customer base compared to 2019.
Payroll taxes and benefits for 2020 totaled $418.8 million or 47.5% of revenue compared to $429.7 million or 45.6% of revenue for 2019. The increase in payroll taxes and benefits as a percentage of revenues is primarily due to the relative increase in PEO services within the mix of our customer base compared to 2019.
Workers’ compensation expense for 2020 totaled $200.7 million or 22.8% of revenue compared to $211.9 million or 22.5% of revenue for 2019. The increase in workers’ compensation expense as a percentage of revenue was primarily due to a favorable adjustment of $6.4 million in 2020 compared to a favorable adjustment of $13.4 million in 2019 related to claims incurred in prior periods.
Selling, general and administrative (“SG&A”) expenses for 2020 totaled $141.9 million or 16.1% of revenue compared to $153.9 million or 16.3% of revenue for 2019. The decrease was primarily attributable to decreases in employee-related expenses and reduced employee profit sharing and incentive compensation of $12.1 million.
Other income, net for 2020 totaled $6.4 million compared to other income of $10.7 million for 2019. The change was attributable to a decrease in investment income of $4.5 million in 2020 due primarily to lower interest rates.
29
Our effective income tax rate for 2020 was 20.7% compared to 21.0% for 2019. Our income tax rate typically differs from the federal statutory tax rate of 21% primarily due to state taxes and federal and state tax credits. See “Note 9 - Income Taxes” to the consolidated financial statements incorporated into Item 8 of Part II of this report for additional information regarding income taxes.
A discussion regarding our financial condition and results of operations for 2019 compared to 2018 can be found under Part II, Item 7. Management's Discussion and Analysis in our Annual Report on Form 10-K for the year ended December 31, 2019, filed with the SEC on March 3, 2020.
Fluctuations in Quarterly Operating Results
We have historically experienced significant fluctuations in our quarterly operating results, including losses in the first quarter of each year, and expect such fluctuations to continue in the future. Our operating results may fluctuate due to a number of factors such as seasonality, wage limits on statutory payroll taxes, claims experience for workers’ compensation, demand for our services, and competition. Payroll taxes, as a component of cost of revenues, generally decline throughout a calendar year as the applicable statutory wage bases for federal and state unemployment taxes and Social Security taxes are exceeded on a per employee basis. Our revenue levels may be higher in the third quarter due to the effect of increased business activity of our customers’ businesses in the agriculture, food processing and forest products-related industries. In addition, revenues in the fourth quarter may be reduced by many customers’ practice of operating on holiday-shortened schedules. Workers’ compensation expense varies with both the frequency and severity of workplace injury claims reported during a quarter and the estimated future costs of such claims. In addition, positive or adverse loss development of prior period claims during a subsequent quarter may also contribute to the volatility in the Company’s estimated workers’ compensation expense.
Liquidity and Capital Resources
The Company's cash balance of $233.8 million, which includes cash, cash equivalents, and restricted cash, decreased $39.5 million for the twelve months ended December 31, 2020, compared to an increase of $132.6 million for the comparable period of 2019. The decrease in cash at December 31, 2020 as compared to December 31, 2019 was primarily due to decreased workers’ compensation claims liabilities, decreased accrued payroll, payroll taxes and related benefits, dividends payments and repurchases of common stock, partially offset by decreased trade accounts receivable, net income and proceeds from the sales and maturities of investments and restricted investments.
Net cash used in operating activities in 2020 amounted to $27.9 million, compared to net cash provided of $77.1 million for the comparable period of 2019. In 2020, cash used in operating activities was primarily due to decreased workers’ compensation claims liabilities of $80.8 million related primarily to the transfer of obligations associated with certain claims incurred between February 1, 2014 and December 31, 2017, decreased accrued payroll, payroll taxes and related benefits of $22.6 million and decreased safety incentive of $9.1 million, partially offset by decreased trade accounts receivable of $45.1 million and net income of $33.8 million
Net cash provided by investing activities totaled $4.1 million in 2020, compared to net cash provided of $66.3 million for the comparable period of 2019. In 2020, net cash provided by investing activities consisted primarily of proceeds from sales and maturities of investments and restricted investments of $113.5 million, partially offset by purchases of investments and restricted investments of $100.7 million and purchases of property, equipment and software of $8.6 million.
Net cash used in financing activities in 2020 was $15.7 million compared to net cash used of $10.8 million for the comparable period of 2019. In 2020, cash was primarily used for dividend payments of $9.1 million, repurchases of common stock of $8.1 million, and common stock repurchased on vesting of stock awards of $1.4 million, partially offset by proceeds from exercises of stock options of $3.1 million.
30
As part of its fronted workers’ compensation insurance program with Chubb, the Company makes monthly collateral payments into trust accounts (the “Chubb trust accounts”). The balance in the Chubb trust accounts was $290.7 million and $393.5 million at December 31, 2020 and December 31, 2019, respectively. Included within the Chubb trust account at December 31, 2020, is $122.2 million of restricted cash. The restricted cash accrues interest at the 3-month Treasury bill yield rate plus 0.25%. The Chubb trust account balances are included as a component of the current and long-term restricted cash and investments on the Company’s consolidated balance sheets.
On June 29, 2020, the Company entered into a loss portfolio transfer agreement to remove all outstanding workers’ compensation claims obligations for claims incurred under its fronted insurance program between February 1, 2014 and December 31, 2017. This transaction reduced the Company’s outstanding workers’ compensation liabilities and trust account balances by $115.7 million. As part of the loss portfolio transfer and due to the Company’s continued favorable claims experience, third-party collateral requirements were reduced by $48.9 million, resulting in an increase in cash and cash equivalents and a decrease in restricted cash and investments.
On September 30, 2020, the Company entered into an amended credit agreement (the “Agreement”) with the Bank, which reverted to the provisions set forth in the agreement prior to May 15, 2020. The Agreement reduced the revolving credit line from $50.0 million back to $33.0 million; the sublimit for standby letters of credit remains at $8.0 million. At December 31, 2020, $6.2 million of the sublimit for standby letters of credit was used. The Agreement expires on July 1, 2022.
Advances under the revolving credit line bear interest, as selected by the Company, of (a) the daily floating rate of one-month LIBOR plus 1.75% or (b) the fixed rate of LIBOR plus 1.75%. The Agreement also provides for an unused commitment fee of 0.375% per year on the average daily unused amount of the revolving credit line, as well as a fee of 1.75% of the face amount of each letter of credit reserved under the line of credit. The Company had no outstanding borrowings on its revolving credit line at December 31, 2020 and 2019. The credit facility is collateralized by the Company’s accounts receivable and other rights to receive payment.
The Agreement also provides for a $63.7 million standby letter of credit (the “Chubb Letter of Credit”). The Chubb Letter of Credit has an expiration date of July 1, 2021, subject to automatic renewal in specified circumstances. The Bank has been granted a security interest of first priority in certain blocked securities accounts (collectively, the “Collateral Accounts”). The Company has agreed to deposit in the Collateral Accounts 50% of the Company’s consolidated net income (after tax and less cash dividends) for each quarter plus, to the extent necessary, an additional amount by May 15 each year so that the deposits in the Collateral Accounts for the prior year total at least $16 million. Through the fourth quarter of 2020, the Company deposited $38.9 million into the Collateral Accounts.
The initial fee paid under the Chubb Letter of Credit in June 2018 was equal to 2.5% of the face amount thereof. Upon annual renewal, the fees payable to the Bank quarterly in advance include (a) a fee at the annual rate of 2.5%, calculated based on the difference between the face amount of the Chubb Letter of Credit and 95% of the aggregate value of the Collateral Accounts as of the end of the previous quarter, (b) a fee at the annual rate of 1.0% calculated based on the balance of the face amount, and (c) other fees upon the payment or negotiation of each drawing under the Chubb Letter of Credit.
The Agreement requires the satisfaction of certain financial covenants as follows:
|
|
• |
EBITDA [net income before taxes plus interest expense (net of capitalized interest expense), depreciation expense, and amortization expense] on a rolling four-quarter basis must be not less than $30 million at the end of each fiscal quarter; and |
|
|
• |
the ratio of restricted and unrestricted cash and investments to workers’ compensation and safety incentive liabilities must be at least 1.0:1.0, measured quarterly. |
31
The Agreement imposes certain additional restrictions unless the Bank provides its prior written consent as follows:
|
|
• |
incurring additional indebtedness is prohibited, other than purchase financing for the acquisition of assets, provided that the aggregate of all purchase financing does not exceed $1,000,000 at any time; |
|
|
• |
the Company may not terminate or cancel any of the AICE policies; and |
|
|
• |
if an event of default would occur, including on a pro forma basis, no dividends or distributions would be permitted to be paid and redemptions and repurchases of the Company’s stock would be permitted only up to $15 million in any rolling 12-month period. |
The Agreement also contains customary events of default and specified cross-defaults under the Company's workers' compensation insurance arrangements. If an event of default under the Agreement occurs and is continuing, the Bank may declare any outstanding obligations under the Agreement to be immediately due and payable. At December 31, 2020, the Company was in compliance with all covenants.
The Company maintains a mortgage loan with the Bank with a balance of approximately $3.7 million and $4.0 million at December 31, 2020 and 2019, respectively, secured by the Company’s corporate office building in Vancouver, Washington. This loan requires payment of monthly installments of $18,375, bearing interest at the one-month LIBOR plus 2.0%, with the unpaid principal balance due July 1, 2022. LIBOR likely will no longer be in general use as a reference rate by financial institutions by December 31, 2021.
Management expects that the funds anticipated to be generated from operations, current liquid assets, and availability under the Company’s revolving credit facility will be sufficient in the aggregate to fund the Company’s working capital needs for the next twelve months.
Contractual Obligations
The Company's contractual obligations as of December 31, 2020 are summarized below:
|
|
|
As of December 31, 2020 |
|
|||||||||||||||||
|
|
|
Payments Due by Period |
|
|||||||||||||||||
|
(in thousands) |
|
|
|
|
|
Less than |
|
|
1 - 3 |
|
|
4 - 5 |
|
|
After |
|
||||
|
|
|
Total |
|
|
1 Year |
|
|
Years |
|
|
Years |
|
|
5 Years |
|
|||||
|
Operating leases (1) |
|
$ |
28,747 |
|
|
$ |
8,821 |
|
|
$ |
13,277 |
|
|
$ |
5,524 |
|
|
$ |
1,125 |
|
|
Long-term debt |
|
|
3,731 |
|
|
|
221 |
|
|
|
3,510 |
|
|
|
— |
|
|
|
— |
|
|
Total contractual obligations |
|
$ |
32,478 |
|
|
$ |
9,042 |
|
|
$ |
16,787 |
|
|
$ |
5,524 |
|
|
$ |
1,125 |
|
(1) As of December 31, 2020, the Company has additional operating leases that have not yet commenced of $2.9 million and remaining balances on short-term operating leases of $7,290.
32
Inflation
Inflation generally has not been a significant factor in the Company's operations during the periods discussed above. The Company has taken into account the impact of escalating medical and other costs in establishing reserves for future workers' compensation claims payments.
|
Item 7A. |
QUANTITATIVE AND QUALITATIVE DISCLOSURES ABOUT MARKET RISK |
The Company's exposure to market risk for changes in interest rates primarily relates to its investment portfolio and its outstanding borrowings on its line of credit and long-term debt. As of December 31, 2020, the Company’s investments consisted principally of approximately $144.8 million in corporate bonds, $82.1 million in money market funds, $55.5 million in mortgage backed securities, $40.4 million in U.S. government agency securities, $37.1 million in asset backed securities, $5.0 million in mutual funds, $4.8 million in supranational bonds, and $4.5 million in U.S. treasuries. The Company’s outstanding debt totaled approximately $3.7 million at December 31, 2020. Based on the Company's overall interest exposure at December 31, 2020, a 50 basis point increase in market interest rates would have a $3.2 million effect on the fair value of the Company's investment portfolio. A 50 basis point increase would have an immaterial effect on the Company’s outstanding borrowings because of the relative size of the outstanding borrowings.
33
Item 8.FINANCIAL STATEMENTS AND SUPPLEMENTARY DATA
REPORT OF INDEPENDENT REGISTERED PUBLIC ACCOUNTING FIRM
To the Stockholders and the Board of Directors of
Barrett Business Services, Inc.
Vancouver, Washington
Opinion on the Financial Statements
We have audited the accompanying consolidated balance sheets of Barrett Business Services, Inc. and subsidiaries (the "Company") as of December 31, 2020 and 2019, the related consolidated statements of operations, comprehensive income, stockholder's equity, and cash flows for each of the three years in the period ended December 31, 2020, and the related notes (collectively referred to as the "financial statements"). In our opinion, the financial statements present fairly, in all material respects, the financial position of the Company as of December 31, 2020 and 2019, and the results of its operations and its cash flows for each of the three years in the period ended December 31, 2020, in conformity with accounting principles generally accepted in the United States of America.
We have also audited, in accordance with the standards of the Public Company Accounting Oversight Board (United States) (PCAOB), the Company's internal control over financial reporting as of December 31, 2020, based on criteria established in Internal Control — Integrated Framework (2013) issued by the Committee of Sponsoring Organizations of the Treadway Commission and our report dated March 8, 2021, expressed an unqualified opinion on the Company's internal control over financial reporting.
Basis for Opinion
These financial statements are the responsibility of the Company's management. Our responsibility is to express an opinion on the Company's financial statements based on our audits. We are a public accounting firm registered with the PCAOB and are required to be independent with respect to the Company in accordance with the U.S. federal securities laws and the applicable rules and regulations of the Securities and Exchange Commission and the PCAOB.
We conducted our audits in accordance with the standards of the PCAOB. Those standards require that we plan and perform the audit to obtain reasonable assurance about whether the financial statements are free of material misstatement, whether due to error or fraud. Our audits included performing procedures to assess the risks of material misstatement of the financial statements, whether due to error or fraud, and performing procedures that respond to those risks. Such procedures included examining, on a test basis, evidence regarding the amounts and disclosures in the financial statements. Our audits also included evaluating the accounting principles used and significant estimates made by management, as well as evaluating the overall presentation of the financial statements. We believe that our audits provide a reasonable basis for our opinion.
Critical Audit Matter
The critical audit matter communicated below is a matter arising from the current-period audit of the financial statements that was communicated or required to be communicated to the audit committee and that (1) relates to accounts or disclosures that are material to the financial statements and (2) involved our especially challenging, subjective, or complex judgments. The communication of critical audit matters does not alter in any way our opinion on the financial statements, taken as a whole, and we are not, by communicating the critical audit matter below, providing a separate opinion on the critical audit matter or on the accounts or disclosures to which it relates.
34
Workers' Compensation Claims Liabilities
Workers’ compensation claims liabilities represent management’s estimate of future amounts necessary to pay claims and related expenses with respect to workplace injuries that have occurred as of a given reporting date. The estimated liability for open workers’ compensation claims is based on an evaluation of information provided by the Company’s third-party administrators for workers’ compensation claims, coupled with an actuarial estimate of future adverse loss development with respect to reported claims and incurred but not reported claims (together, IBNR). Workers’ compensation claims liabilities included case reserve estimates for reported losses, plus additional amounts for estimated IBNR claims, medical cost containment, legal costs, and unallocated loss adjustment expenses. The process of arriving at an estimate of unpaid claims and claims adjustment expense involves a high degree of judgment and is affected by both internal and external events, including changes in claims handling practices, changes in reserve estimation procedures, inflation, trends in the litigation and settlement of pending claims, and legislative changes. The Company’s estimates are based on informed judgment, derived from individual experience and expertise applied to multiple sets of data and analyses. The company considers significant facts and circumstances known both at the time that loss reserves are initially established, and as new facts and circumstances become known. Workers’ compensation claims liabilities as of December 31, 2020 were $358 million.
Given the high degree of judgment required to estimate the value of the workers’ compensation claims liabilities, performing audit procedures to evaluate the workers’ compensation claims liabilities recorded for the year ended December 31, 2020, required a high degree of auditor judgment and an increased extent of effort, including the need to involve our actuarial specialists.
How the Critical Audit Matter Was Addressed in the Audit
Our audit procedures related to the workers’ compensation claims liabilities included the following, among others:
|
|
• |
We tested the effectiveness of controls related to workers’ compensation claims liabilities, including those over estimating the value of reported and IBNR losses for workers’ compensation. |
|
|
• |
We tested the underlying data that served as inputs into the actuarial analysis, including historical claims, to evaluate whether inputs were reasonable. In addition, we assessed whether any changes in the business or environment, including legislative changes, interest rates, and claims handling practices, were appropriately considered in the reserve setting process. |
|
|
• |
With the assistance of our actuarial specialists, we evaluated the methods and assumptions used by management to estimate the workers’ compensation claims liabilities by performing the following: |
|
|
• |
Compared management’s prior-year assumptions of expected claims development and ultimate loss to actuals incurred during the current year to identify and evaluate potential bias in the determination of the workers’ compensation claims liabilities. |
|
|
• |
Developed a range of independent estimates of the workers’ compensation claims liabilities, utilizing claim payment patterns, loss development factors, and future cost trends for workers’ compensation claims liabilities. We compared our estimated ranges to management’s estimates. |
/s/ Deloitte & Touche LLP
Portland, Oregon
March 8, 2021
We have served as the Company's auditor since 2016.
35
Barrett Business Services, Inc.
Consolidated Balance Sheets
December 31, 2020 and 2019
(In Thousands, Except Par Value)
|
|
|
December 31, |
|
|
December 31, |
|
||
|
|
|
2020 |
|
|
2019 |
|
||
|
ASSETS |
|
|
|
|
|
|
|
|
|
Current assets: |
|
|
|
|
|
|
|
|
|
Cash and cash equivalents |
|
$ |
|
|
|
$ |
|
|
|
Investments |
|
|
|
|
|
|
|
|
|
Trade accounts receivable, net |
|
|
|
|
|
|
|
|
|
Income taxes receivable |
|
|
|
|
|
|
|
|
|
Prepaid expenses and other |
|
|
|
|
|
|
|
|
|
Restricted cash and investments |
|
|
|
|
|
|
|
|
|
Total current assets |
|
|
|
|
|
|
|
|
|
Property, equipment and software, net |
|
|
|
|
|
|
|
|
|
Operating lease right-of-use assets |
|
|
|
|
|
|
|
|
|
Restricted cash and investments |
|
|
|
|
|
|
|
|
|
Goodwill |
|
|
|
|
|
|
|
|
|
Other assets |
|
|
|
|
|
|
|
|
|
Deferred income taxes |
|
|
— |
|
|
|
|
|
|
|
|
$ |
|
|
|
$ |
|
|
|
LIABILITIES AND STOCKHOLDERS' EQUITY |
|
|
|
|
|
|
|
|
|
Current liabilities: |
|
|
|
|
|
|
|
|
|
Current portion of long-term debt |
|
$ |
|
|
|
$ |
|
|
|
Accounts payable |
|
|
|
|
|
|
|
|
|
Accrued payroll, payroll taxes and related benefits |
|
|
|
|
|
|
|
|
|
Current operating lease liabilities |
|
|
|
|
|
|
|
|
|
Other accrued liabilities |
|
|
|
|
|
|
|
|
|
Workers' compensation claims liabilities |
|
|
|
|
|
|
|
|
|
Safety incentives liability |
|
|
|
|
|
|
|
|
|
Total current liabilities |
|
|
|
|
|
|
|
|
|
Long-term workers' compensation claims liabilities |
|
|
|
|
|
|
|
|
|
Long-term debt |
|
|
|
|
|
|
|
|
|
Deferred income taxes |
|
|
|
|
|
|
— |
|
|
Long-term operating lease liabilities |
|
|
|
|
|
|
|
|
|
Customer deposits and other long-term liabilities |
|
|
|
|
|
|
|
|
|
Total liabilities |
|
|
|
|
|
|
|
|
|
Commitments and contingencies (Notes 6, 8 and 12) |
|
|
|
|
|
|
|
|
|
Stockholders' equity: |
|
|
|
|
|
|
|
|
|
Common stock, $ and |
|
|
|
|
|
|
|
|
|
Additional paid-in capital |
|
|
|
|
|
|
|
|
|
Accumulated other comprehensive income |
|
|
|
|
|
|
|
|
|
Retained earnings |
|
|
|
|
|
|
|
|
|
Total stockholders' equity |
|
|
|
|
|
|
|
|
|
|
|
$ |
|
|
|
$ |
|
|
The accompanying notes are an integral part of these consolidated financial statements.
36
Barrett Business Services, Inc.
Consolidated Statements of Operations
Years Ended December 31, 2020, 2019 and 2018
(In Thousands, Except Per Share Amounts)
|
|
Year Ended |
|
|||||||
|
|
December 31, |
|
|||||||
|
|
2020 |
|
2019 |
|
2018 |
|
|||
|
Revenues: |
|
|
|
|
|
|
|
|
|
|
Professional employer service fees |
$ |
|
|
$ |
|
|
$ |
|
|
|
Staffing services |
|
|
|
|
|
|
|
|
|
|
Total revenues |
|
|
|
|
|
|
|
|
|
|
Cost of revenues: |
|
|
|
|
|
|
|
|
|
|
Direct payroll costs |
|
|
|
|
|
|
|
|
|
|
Payroll taxes and benefits |
|
|
|
|
|
|
|
|
|
|
Workers' compensation |
|
|
|
|
|
|
|
|
|
|
Total cost of revenues |
|
|
|
|
|
|
|
|
|
|
Gross margin |
|
|
|
|
|
|
|
|
|
|
Selling, general and administrative expenses |
|
|
|
|
|
|
|
|
|
|
Depreciation and amortization |
|
|
|
|
|
|
|
|
|
|
Income from operations |
|
|
|
|
|
|
|
|
|
|
Other income (expense): |
|
|
|
|
|
|
|
|
|
|
Investment income, net |
|
|
|
|
|
|
|
|
|
|
Interest expense |
|
( |
) |
|
( |
) |
|
( |
) |
|
Other, net |
|
( |
) |
|
( |
) |
|
( |
) |
|
Other income, net |
|
|
|
|
|
|
|
|
|
|
Income before income taxes |
|
|
|
|
|
|
|
|
|
|
Provision for income taxes |
|
|
|
|
|
|
|
|
|
|
Net income |
$ |
|
|
$ |
|
|
$ |
|
|
|
Basic income per common share |
$ |
|
|
$ |
|
|
$ |
|
|
|
Weighted average number of basic common shares outstanding |
|
|
|
|
|
|
|
|
|
|
Diluted income per common share |
$ |
|
|
$ |
|
|
$ |
|
|
|
Weighted average number of diluted common shares outstanding |
|
|
|
|
|
|
|
|
|
The accompanying notes are an integral part of these consolidated financial statements.
37
Barrett Business Services, Inc.
Consolidated Statements of Comprehensive Income
Years Ended December 31, 2020, 2019 and 2018
(In Thousands)
|
|
|
Year Ended |
|
|||||||||
|
|
|
December 31, |
|
|||||||||
|
|
|
2020 |
|
|
2019 |
|
|
2018 |
|
|||
|
Net income |
|
$ |
|
|
|
$ |
|
|
|
$ |
|
|
|
Unrealized gains (losses) on investments, net of tax of $ and ($ |
|
|
|
|
|
|
|
|
|
|
( |
) |
|
Comprehensive income |
|
$ |
|
|
|
$ |
|
|
|
$ |
|
|
The accompanying notes are an integral part of these consolidated financial statements.
38
Barrett Business Services, Inc.
Consolidated Statements of Stockholders' Equity
Years Ended December 31, 2020, 2019 and 2018
(In Thousands)
|
|
|
|
|
|
|
|
|
|
|
|
|
|
|
|
Accumulated |
|
|
|
|
|
|
|
|
|
|
|
|
|
|
|
|
|
|
|
|
|
|
|
|
|
|
Other |
|
|
|
|
|
|
|
|
|
|
|
|
|
|
|
|
|
|
|
|
|
|
Additional |
|
|
Comprehensive |
|
|
|
|
|
|
|
|
|
||
|
|
Common Stock |
|
|
Paid-in |
|
|
(Loss) |
|
|
Retained |
|
|
|
|
|
||||||||||
|
|
Shares |
|
|
|
|
Amount |
|
|
Capital |
|
|
Income |
|
|
Earnings |
|
|
Total |
|
||||||
|
Balance, December 31, 2017 |
|
|
|
|
|
|
$ |
|
|
|
$ |
|
|
|
$ |
( |
) |
|
$ |
|
|
|
$ |
|
|
|
Common stock issued on exercise of options and vesting of restricted stock units |
|
|
|
|
|
|
|
|
|
|
|
|
|
|
|
— |
|
|
|
— |
|
|
|
|
|
|
Common stock repurchased on vesting of restricted stock units |
|
( |
) |
|
|
|
|
— |
|
|
|
( |
) |
|
|
— |
|
|
|
— |
|
|
|
( |
) |
|
Share-based compensation expense |
|
— |
|
|
|
|
|
— |
|
|
|
|
|
|
|
— |
|
|
|
— |
|
|
|
|
|
|
Cash dividends on common stock ($ per share) |
|
— |
|
|
|
|
|
— |
|
|
|
— |
|
|
|
— |
|
|
|
( |
) |
|
|
( |
) |
|
Unrealized loss on investments, net of tax |
|
— |
|
|
|
|
|
— |
|
|
|
— |
|
|
|
( |
) |
|
|
— |
|
|
|
( |
) |
|
Net income |
|
— |
|
|
|
|
|
— |
|
|
|
— |
|
|
|
— |
|
|
|
|
|
|
|
|
|
|
Balance, December 31, 2018 |
|
|
|
|
|
|
$ |
|
|
|
$ |
|
|
|
$ |
( |
) |
|
$ |
|
|
|
$ |
|
|
|
Common stock issued on exercise of options and vesting of restricted stock units |
|
|
|
|
|
|
|
|
|
|
|
|
|
|
|
— |
|
|
|
— |
|
|
|
|
|
|
Common stock repurchased on vesting of restricted stock units |
|
( |
) |
|
|
|
|
— |
|
|
|
( |
) |
|
|
— |
|
|
|
— |
|
|
|
( |
) |
|
Share-based compensation expense |
|
— |
|
|
|
|
|
— |
|
|
|
|
|
|
|
— |
|
|
|
— |
|
|
|
|
|
|
Cash dividends on common stock ($ per share) |
|
— |
|
|
|
|
|
— |
|
|
|
— |
|
|
|
— |
|
|
|
( |
) |
|
|
( |
) |
|
Unrealized gain on investments, net of tax |
|
— |
|
|
|
|
|
— |
|
|
|
— |
|
|
|
|
|
|
|
— |
|
|
|
|
|
|
Net income |
|
— |
|
|
|
|
|
— |
|
|
|
— |
|
|
|
— |
|
|
|
|
|
|
|
|
|
|
Balance, December 31, 2019 |
|
|
|
|
|
|
$ |
|
|
|
$ |
|
|
|
$ |
|
|
|
$ |
|
|
|
$ |
|
|
|
Common stock issued on exercise of options and vesting of restricted stock units |
|
|
|
|
|
|
|
|
|
|
|
|
|
|
|
— |
|
|
|
— |
|
|
|
|
|
|
Common stock repurchased on vesting of stock awards |
|
( |
) |
|
|
|
|
— |
|
|
|
( |
) |
|
|
— |
|
|
|
— |
|
|
|
( |
) |
|
Share-based compensation expense |
|
— |
|
|
|
|
|
— |
|
|
|
|
|
|
|
— |
|
|
|
— |
|
|
|
|
|
|
Company repurchase of common stock |
|
( |
) |
|
|
|
|
( |
) |
|
|
( |
) |
|
|
— |
|
|
|
( |
) |
|
|
( |
) |
|
Cash dividends on common stock ($ per share) |
|
— |
|
|
|
|
|
— |
|
|
|
— |
|
|
|
— |
|
|
|
( |
) |
|
|
( |
) |
|
Unrealized gain on investments, net of tax |
|
— |
|
|
|
|
|
— |
|
|
|
— |
|
|
|
|
|
|
|
— |
|
|
|
|
|
|
Net income |
|
— |
|
|
|
|
|
— |
|
|
|
— |
|
|
|
— |
|
|
|
|
|
|
|
|
|
|
Balance, December 31, 2020 |
|
|
|
|
|
|
$ |
|
|
|
$ |
|
|
|
$ |
|
|
|
$ |
|
|
|
$ |
|
|
The accompanying notes are an integral part of these consolidated financial statements.
39
Barrett Business Services, Inc.
Consolidated Statements of Cash Flows
Years Ended December 31, 2020, 2019 and 2018
(In Thousands)
|
|
|
Year Ended |
|
|||||||||
|
|
|
December 31, |
|
|||||||||
|
|
|
2020 |
|
|
2019 |
|
|
2018 |
|
|||
|
Cash flows from operating activities: |
|
|
|
|
|
|
|
|
|
|
|
|
|
Net income |
|
$ |
|
|
|
$ |
|
|
|
$ |
|
|
|
Reconciliations of net income to net cash (used in) provided by operating activities: |
|
|
|
|
|
|
|
|
|
|
|
|
|
Depreciation and amortization |
|
|
|
|
|
|
|
|
|
|
|
|
|
Non-cash operating lease expense |
|
|
|
|
|
|
|
|
|
|
— |
|
|
Investment (accretion) amortization and (gains) losses recognized |
|
|
|
|
|
|
|
|
|
|
|
|
|
Loss recognized on sale or disposal of property and equipment |
|
|
|
|
|
|
— |
|
|
|
|
|
|
Deferred income taxes |
|
|
|
|
|
|
|
|
|
|
( |
) |
|
Share-based compensation |
|
|
|
|
|
|
|
|
|
|
|
|
|
Changes in certain operating assets and liabilities: |
|
|
|
|
|
|
|
|
|
|
|
|
|
Trade accounts receivable |
|
|
|
|
|
|
( |
) |
|
|
( |
) |
|
Income taxes |
|
|
( |
) |
|
|
( |
) |
|
|
|
|
|
Prepaid expenses and other |
|
|
( |
) |
|
|
( |
) |
|
|
( |
) |
|
Accounts payable |
|
|
( |
) |
|
|
|
|
|
|
( |
) |
|
Accrued payroll, payroll taxes and related benefits |
|
|
( |
) |
|
|
|
|
|
|
( |
) |
|
Other accrued liabilities |
|
|
( |
) |
|
|
( |
) |
|
|
|
|
|
Workers' compensation claims liabilities |
|
|
( |
) |
|
|
|
|
|
|
|
|
|
Safety incentives liability |
|
|
( |
) |
|
|
( |
) |
|
|
|
|
|
Operating lease liabilities |
|
|
( |
) |
|
|
( |
) |
|
|
— |
|
|
Other assets and liabilities, net |
|
|
( |
) |
|
|
( |
) |
|
|
( |
) |
|
Net cash (used in) provided by operating activities |
|
|
( |
) |
|
|
|
|
|
|
|
|
|
Cash flows from investing activities: |
|
|
|
|
|
|
|
|
|
|
|
|
|
Purchase of property, equipment and software |
|
|
( |
) |
|
|
( |
) |
|
|
( |
) |
|
Proceeds from sale of property |
|
|
— |
|
|
|
— |
|
|
|
|
|
|
Purchase of investments |
|
|
( |
) |
|
|
( |
) |
|
|
( |
) |
|
Proceeds from sales and maturities of investments |
|
|
|
|
|
|
|
|
|
|
|
|
|
Purchase of restricted investments |
|
|
( |
) |
|
|
( |
) |
|
|
( |
) |
|
Proceeds from sales and maturities of restricted investments |
|
|
|
|
|
|
|
|
|
|
|
|
|
Net cash provided by (used in) investing activities |
|
|
|
|
|
|
|
|
|
|
( |
) |
|
Cash flows from financing activities: |
|
|
|
|
|
|
|
|
|
|
|
|
|
Proceeds from credit-line borrowings |
|
|
— |
|
|
|
|
|
|
|
|
|
|
Payments on credit-line borrowings |
|
|
— |
|
|
|
( |
) |
|
|
( |
) |
|
Payments on long-term debt |
|
|
( |
) |
|
|
( |
) |
|
|
( |
) |
|
Repurchase of common stock |
|
|
( |
) |
|
|
— |
|
|
|
— |
|
|
Common stock repurchased on vesting of stock awards |
|
|
( |
) |
|
|
( |
) |
|
|
( |
) |
|
Dividends paid |
|
|
( |
) |
|
|
( |
) |
|
|
( |
) |
|
Proceeds from exercise of stock options |
|
|
|
|
|
|
|
|
|
|
|
|
|
Net cash used in financing activities |
|
|
( |
) |
|
|
( |
) |
|
|
( |
) |
|
Net (decrease) increase in cash, cash equivalents and restricted cash |
|
|
( |
) |
|
|
|
|
|
|
|
|
|
Cash, cash equivalents and restricted cash, beginning of period |
|
|
|
|
|
|
|
|
|
|
|
|
|
Cash, cash equivalents and restricted cash, end of period |
|
$ |
|
|
|
$ |
|
|
|
$ |
|
|
The accompanying notes are an integral part of these consolidated financial statements.
40
Barrett Business Services, Inc.
Notes to Consolidated Financial Statements
Note 1 - Summary of Operations and Significant Accounting Policies
Nature of operations
Barrett Business Services, Inc. (“BBSI” or the “Company”), is a leading provider of business management solutions for small and mid-sized companies. The Company has developed a management platform that integrates a knowledge-based approach from the management consulting industry with tools from the human resource outsourcing industry. This platform, through the effective leveraging of human capital, helps our business owner clients run their businesses more effectively.
We believe this platform, delivered through our decentralized organizational structure, differentiates BBSI from our competitors. The Company operates through a network of
The Company operates a wholly owned, fully licensed captive insurance company, Associated Insurance Company for Excess ("AICE") and a wholly owned, fully licensed insurance company, Ecole. AICE and Ecole provide access to more competitive and cost-effective insurance markets and provide cost-effective risk management. See “Note 5 – Workers’ Compensation Claims” for additional information on the Company’s insurance programs.
Principles of consolidation
The accompanying financial statements are prepared on a consolidated basis. All intercompany account balances and transactions between BBSI, AICE, and Ecole have been eliminated in consolidation.
Reportable segment
The Company has
41
Revenue recognition
Professional employer (“PEO”) services are normally used by organizations to satisfy ongoing needs related to the management of human capital and are governed by the terms of a client services agreement which covers all employees at a particular work site. Staffing revenues relate primarily to short-term staffing, contract staffing and on-site management services. The Company’s performance obligations for PEO and staffing services are satisfied, and the related revenue is recognized, as services are rendered by our workforce.
Our PEO client service agreements have a minimum term of
We report PEO revenues net of direct payroll costs because we are not the primary obligor for these payments to our clients’ employees. Direct payroll costs include salaries, wages, health insurance, and employee out-of-pocket expenses incurred incidental to employment. We also present revenue net of safety incentives, because these incentives represent consideration payable to customers.
Cost of revenues
Our cost of revenues for PEO services includes employer payroll-related taxes and workers' compensation costs. Our cost of revenues for staffing services includes direct payroll costs, employer payroll-related taxes, employee benefits, and workers’ compensation costs. Direct payroll costs represent the gross payroll earned by staffing services employees based on salary or hourly wages. Payroll taxes and employee benefits consist of the employer's portion of Social Security and Medicare taxes, federal and state unemployment taxes, and staffing services employee reimbursements for materials, supplies and other expenses, which are paid by our customer. Workers' compensation costs consist primarily of claims reserves, claims administration fees, legal fees, medical cost containment (“MCC”) expense, state administrative agency fees, third-party broker commissions, risk manager payroll, premiums for excess insurance, and the fronted insurance program, as well as costs associated with operating our
Cash and cash equivalents
We consider non-restricted short-term investments that are highly liquid, readily convertible into cash, and have maturities at acquisition of less than
Investments
The Company classifies investments as available-for-sale. The Company’s investments are reported at fair value with unrealized gains and losses, net of taxes, shown as a component of accumulated other comprehensive income (loss) in stockholders' equity. Investments are recorded as current on the consolidated balance sheets as the invested funds are available for current operations. Management considers available evidence in evaluating potential impairment of investments, including the extent to which fair value is less than cost and adverse conditions related to the security. In the event of a credit loss, an allowance would be recognized to the extent that the fair value of the security is less than the present value of the expected future cash flows. Realized gains and losses on sales of investments are included in investment income in our consolidated statements of operations.
42
Restricted cash and investments
The Company holds restricted cash and investments primarily for the future payment of workers’ compensation claims. These investments are categorized as available-for-sale. They are reported at fair value with unrealized gains and losses, net of taxes, shown as a component of accumulated other comprehensive income (loss) in stockholders’ equity. Restricted cash and investments are classified as current and noncurrent on the consolidated balance sheets based on the nature of the restriction. Management considers available evidence in evaluating potential impairment of restricted investments, including the extent to which fair value is less than cost and adverse conditions related to the security. In the event of a credit loss, an allowance would be recognized to the extent that the fair value of the security is less than the present value of the expected future cash flows. Realized gains and losses on sales of restricted investments are included in investment income in our consolidated statements of operations.
Restricted cash and investments also includes investments held as part of the Company’s deferred compensation plan. These investments are classified as trading securities and are recorded at fair value with unrealized gains and losses reported as a component of income (loss) from operations.
Allowance for doubtful accounts
The Company had an allowance for doubtful accounts of $
Our allowance for doubtful accounts activity is summarized as follows (in thousands):
|
|
|
2020 |
|
|
2019 |
|
|
2018 |
|
|||
|
Balance at January 1, |
|
|
|
|
|
|
|
|
|
|
|
|
|
Allowance for doubtful accounts |
|
$ |
|
|
|
$ |
|
|
|
$ |
|
|
|
Charges to expense |
|
|
|
|
|
|
|
|
|
|
|
|
|
Write-offs of uncollectible accounts, net of recoveries |
|
|
( |
) |
|
|
( |
) |
|
|
— |
|
|
Balance at December 31, |
|
|
|
|
|
|
|
|
|
|
|
|
|
Allowance for doubtful accounts |
|
$ |
|
|
|
$ |
|
|
|
$ |
|
|
43
Income taxes
Our income taxes are accounted for using an asset and liability approach. This requires the recognition of deferred tax assets and liabilities for the expected future tax consequences of temporary differences between the financial statement and tax basis of assets and liabilities at the applicable tax rates. A valuation allowance is recorded against deferred tax assets if, based on the weight of the available evidence, it is more likely than not that some or all of the deferred tax assets will not be realized. The factors used to assess the likelihood of realization include the Company’s forecast of the reversal of temporary differences, future taxable income and available tax planning strategies that could be implemented to realize the net deferred tax assets. Failure to achieve forecasted taxable income in applicable tax jurisdictions could affect the ultimate realization of deferred tax assets and could result in an increase in the Company’s effective tax rate on future earnings.
The determination of our provision for income taxes requires significant judgment, the use of estimates, and the interpretation and application of complex tax laws. Significant judgment is required in assessing the timing and amounts of deductible and taxable items and the probability of sustaining uncertain tax positions. The Company recognizes the tax benefit from uncertain tax positions if it is more likely than not that the tax positions will be sustained on examination by the tax authorities. The tax benefit is measured based on the largest benefit that has a greater than
Goodwill and intangible assets
Goodwill is recorded as the difference, if any, between the aggregate consideration paid for a business combination and the fair value of the net assets acquired. Goodwill is not amortized but is evaluated for impairment annually, or more frequently if circumstances indicate that it is more likely than not that the fair value of the reporting unit is below its carrying value. The Company has
Property, equipment and software
Property, equipment and software are stated at cost. Expenditures for maintenance and repairs are charged to selling, general and administrative expenses as incurred and expenditures for additions and improvements to property and equipment are capitalized. The cost of assets sold or otherwise disposed of and the related accumulated depreciation are eliminated from the accounts, and any resulting gain or loss is reflected in the consolidated statements of operations.
We capitalize software development costs incurred during the application development stage, which is the stage when preliminary project planning ends and software development begins. Capitalized costs generally include both internal and external costs associated with coding and testing. Capitalized costs are amortized on a straight-line basis over the estimated useful life, commencing when the software is placed into service. Costs incurred during the preliminary project stage and the postimplementation stage, as well as general and administrative and overhead costs, are expensed as they are incurred.
Depreciation of property and equipment and amortization of software is calculated using the straight-line method over estimated useful lives of the related assets or lease terms, as follows:
|
|
|
Years |
|
Buildings |
|
|
|
Office furniture and fixtures |
|
|
|
Computer hardware, software and software development costs |
|
|
|
Leasehold improvements |
|
|
44
Impairment of long-lived assets
Long-lived assets, such as property, equipment and software and acquired intangibles subject to amortization, are reviewed for impairment annually, or whenever events or changes in circumstances indicate that the remaining estimated useful life may warrant revision or that the carrying amount of an asset may not be recoverable. Some of the events or changes in circumstances that would trigger an impairment review include, but are not limited to, significant under-performance relative to expected and/or historical results, significant negative industry or economic trends, or knowledge of transactions involving the sale of similar property at amounts below the carrying value.
Assets are grouped for measurement of impairment at the lowest level for which identifiable cash flows are largely independent of the cash flows of other assets. If the carrying amount of an asset group exceeds the estimated undiscounted future cash flows expected to be generated by the asset group, then an impairment charge is recognized to the extent the carrying amount exceeds the asset group’s fair value. In determining fair value, management considers current results, trends, future prospects, and other economic factors.
Leases
The Company leases office facilities and equipment under operating leases. In February 2016, the Financial Accounting Standards Board (“FASB”) issued ASU No. 2016-02, “Leases” (Topic 842) which requires lessees to recognize a right-of-use (“ROU”) asset and a lease liability for all leases with terms greater than 12 months and also requires disclosures by lessees and lessors about the amount, timing and uncertainty of cash flows arising from leases.
On January 1, 2019, we adopted (“ASC”) Topic 842 “Leases” using the optional transition method. Results for the reporting period beginning January 1, 2019 are presented under ASC 842, while prior period amounts were not adjusted and continue to be reported in accordance with the previously applicable lease accounting guidance. See “Note 8 – Leases” for additional information.
Workers’ compensation claims liabilities
Our workers’ compensation claims liabilities do not represent an exact calculation of liability but rather management’s best estimate, utilizing actuarial expertise and projection techniques, at a given reporting date. The estimated liability for open workers’ compensation claims is based on an evaluation of information provided by our third-party administrator for workers’ compensation claims, coupled with an actuarial estimate of future loss development with respect to reported claims and incurred but not reported claims (together, “IBNR”). Workers’ compensation claims liabilities include case reserve estimates for reported losses, plus additional amounts for estimated IBNR claims, MCC and legal costs, unallocated loss adjustment expenses and estimated future recoveries. The estimate of incurred costs expected to be paid within one year is included in current liabilities, while the estimate of incurred costs expected to be paid beyond one year is included in long-term liabilities on our consolidated balance sheets. These estimates are reviewed at least quarterly and adjustments to estimated liabilities are reflected in current operating results as they become known.
The process of arriving at an estimate of unpaid claims and claims adjustment expense involves a high degree of judgment and is affected by both internal and external events, including changes in claims handling practices, changes in reserve estimation procedures, inflation, trends in the litigation and settlement of pending claims, and legislative changes.
Our estimates are based on informed judgment, derived from individual experience and expertise applied to multiple sets of data and analyses. We consider significant facts and circumstances known both at the time that loss reserves are initially established and as new facts and circumstances become known. Due to the inherent uncertainty underlying loss reserve estimates, the expenses incurred through final resolution of our liability for our workers’ compensation claims will likely vary from the related loss reserves at the reporting date. Therefore, as specific claims are paid out in the future, actual paid losses may be materially different from our current loss reserves.
45
A basic premise in most actuarial analyses is that historical data and past patterns demonstrated in the incurred and paid historical data form a reasonable basis upon which to project future outcomes, absent a material change. Significant structural changes to the available data can materially impact the reserve estimation process. To the extent a material change affecting the ultimate claim liability becomes known, such change is quantified to the extent possible through an analysis of internal Company data and, if available and when appropriate, external data. Nonetheless, actuaries exercise a considerable degree of judgment in the evaluation of these factors and the need for such actuarial judgment is more pronounced when faced with material uncertainties.
Customer incentives
We accrue for and present expected safety incentives as a reduction of revenue. Safety incentives represent cash incentives paid to certain PEO client companies for maintaining safe work practices and minimizing workplace injuries. The incentive is based on a percentage of annual payroll and is paid annually to customers who meet predetermined workers’ compensation claims cost objectives. Safety incentive payments are made only after closure of all workers' compensation claims incurred during the customer’s contract period. The safety incentive liability is estimated and accrued each month based upon contract year-to-date payroll and the then current amount of the customer’s estimated workers’ compensation claims reserves as established by us and our third party administrator. The Company provided $
Customer deposits
We require deposits from certain PEO customers to cover a portion of our accounts receivable due from such customers in the event of default of payment.
Comprehensive income (loss)
Comprehensive income (loss) includes all changes in equity during a period except those that resulted from investments by or distributions to the Company's stockholders.
Other comprehensive income (loss) refers to revenues, expenses, gains and losses that under U.S. GAAP are included in comprehensive income (loss), but excluded from net income (loss) as these amounts are recorded directly as an adjustment to stockholders' equity. Our other comprehensive income (loss) comprises unrealized holding gains and losses on our available-for-sale investments.
Statements of cash flows
Interest paid in 2020, 2019, and 2018 did not materially differ from interest expense. Income taxes paid by the Company totaled $
Bank deposits and other cash equivalents that are restricted for use are classified as restricted cash.
|
|
|
December 31, |
|
|
December 31, |
|
|
December 31, |
|
|||
|
|
|
2020 |
|
|
2019 |
|
|
2018 |
|
|||
|
Cash and cash equivalents |
|
$ |
|
|
|
$ |
|
|
|
$ |
|
|
|
Restricted cash, included in restricted cash and investments |
|
|
|
|
|
|
|
|
|
|
|
|
|
Total cash, cash equivalents and restricted cash shown in the statement of cash flows |
|
$ |
|
|
|
$ |
|
|
|
$ |
|
|
46
Basic and diluted earnings per share
Basic earnings per share are computed based on the weighted average number of common shares outstanding for each year using the treasury method. Diluted earnings per share reflect the potential effects of the exercise of outstanding stock options and the issuance of stock associated with outstanding restricted stock units, performance share units and the Company’s employee stock purchase plan.
|
|
|
Year Ended |
|
|||||||||
|
|
|
December 31, |
|
|||||||||
|
|
|
2020 |
|
|
2019 |
|
|
2018 |
|
|||
|
Weighted average number of basic shares outstanding |
|
|
|
|
|
|
|
|
|
|
|
|
|
Effect of dilutive securities |
|
|
|
|
|
|
|
|
|
|
|
|
|
Weighted average number of diluted shares outstanding |
|
|
|
|
|
|
|
|
|
|
|
|
Accounting estimates
The preparation of our consolidated financial statements in conformity with GAAP requires management to make estimates and assumptions that affect the reported amounts of assets and liabilities and disclosure of contingent assets and liabilities at the date of the consolidated financial statements and the reported amounts of revenues and expenses during the reporting periods. Management bases its estimates on historical experience and on various other assumptions that are believed to be reasonable under the circumstances, the results of which form the basis for making judgments about the carrying values of assets and liabilities that are not readily apparent from other sources. Estimates are used for fair value measurement of investments, allowance for doubtful accounts, deferred income taxes, carrying values for goodwill and property, equipment and software, accrued workers' compensation liabilities and safety incentive liabilities. Actual results may or may not differ from such estimates.
Recent accounting pronouncements
In June 2016, the Financial Accounting Standards Board (“FASB”) issued Accounting Standards Update (“ASU”) No. 2016-13, “Financial Instruments – Credit Losses.” The ASU requires the use of an impairment model that is based on expected credit losses rather than incurred losses. The ASU also made changes to the impairment model for available-for-sale securities and requires the use of an allowance approach rather than writing down the security’s cost. The amendments in this update were adopted January 1, 2020 and did not have a material impact on the Company’s financial statements.
47
Note 2 - Concentration of Credit Risk
Financial instruments that potentially subject us to concentration of credit risk consist primarily of cash equivalents, investments, restricted cash and investments, and trade accounts receivable. We limit investment of cash equivalents and investments to financial institutions with high credit ratings. Credit risk on trade accounts is minimized as a result of the large and diverse nature of our customer base.
At December 31, 2020, we had concentrations of credit risk as follows:
|
|
• |
$ |
|
|
• |
$ |
|
|
• |
$ |
|
|
• |
$ |
|
|
• |
$ |
|
|
• |
$ |
|
|
• |
$ |
|
|
• |
$ |
Note 3 - Fair Value Measurement
Fair value is the price that would be received to sell an asset or paid to transfer a liability in an orderly transaction between market participants at the measurement date.
All of our financial instruments are recognized in our consolidated balance sheets. Carrying values approximate fair value of most financial assets and liabilities. Investments and restricted cash and investments are recorded at market value. The interest rates on our investments approximate current market rates for these types of investments.
In determining the fair value of our financial assets, the Company predominately uses the market approach. In determining the fair value of all its corporate bonds, mortgage backed securities, U.S. treasuries, U.S. government agency securities, supranational, mutual funds, money market funds, asset backed securities, and municipal bonds, the Company utilizes non-binding quotes provided by our investment brokers.
Factors used in determining the fair value of our financial assets and liabilities are summarized into three levels as established in the fair value hierarchy framework. The three levels of the fair value hierarchy are described below.
Level 1 – Inputs to the valuation methodology are unadjusted quoted prices for identical assets or liabilities in active markets.
Level 2 – Inputs to the valuation methodology include:
|
|
• |
Quoted prices for similar assets or liabilities in active markets; |
|
|
• |
Quoted prices for identical or similar assets or liabilities in inactive markets; |
|
|
• |
Inputs other than quoted prices that are observable for the asset or liability; |
|
|
• |
Inputs that are derived principally from or corroborated by observable market data by correlation or other means. |
Level 3 - Inputs to the valuation methodology are unobservable and significant to the fair value measurement.
48
In determining the fair value measurement of our financial assets, the fair value measurement level within the hierarchy is based on the lowest level input and is applied to each financial asset. Valuation techniques are used to maximize the use of observable inputs and minimize the use of unobservable inputs.
The following table summarizes the Company’s investments at December 31, 2020 and 2019 measured at fair value on a recurring basis (in thousands):
|
|
|
December 31, 2020 |
|
|
December 31, 2019 |
|
||||||||||||||||||
|
|
|
|
|
|
|
Gross |
|
|
|
|
|
|
|
|
|
|
Gross |
|
|
|
|
|
||
|
|
|
|
|
|
|
Unrealized |
|
|
|
|
|
|
|
|
|
|
Unrealized |
|
|
|
|
|
||
|
|
|
|
|
|
|
Gains |
|
|
Recorded |
|
|
|
|
|
|
Gains |
|
|
Recorded |
|
||||
|
|
|
Cost |
|
|
(Losses) |
|
|
Basis |
|
|
Cost |
|
|
(Losses) |
|
|
Basis |
|
||||||
|
Current: |
|
|
|
|
|
|
|
|
|
|
|
|
|
|
|
|
|
|
|
|
|
|
|
|
|
Cash equivalents: |
|
|
|
|
|
|
|
|
|
|
|
|
|
|
|
|
|
|
|
|
|
|
|
|
|
Money market funds |
|
$ |
|
|
|
$ |
— |
|
|
$ |
|
|
|
$ |
|
|
|
$ |
— |
|
|
$ |
|
|
|
Total cash equivalents |
|
|
|
|
|
|
— |
|
|
|
|
|
|
|
|
|
|
|
— |
|
|
|
|
|
|
Investments: |
|
|
|
|
|
|
|
|
|
|
|
|
|
|
|
|
|
|
|
|
|
|
|
|
|
Corporate bonds |
|
|
|
|
|
|
|
|
|
|
|
|
|
|
|
|
|
|
|
|
|
|
|
|
|
Asset backed securities |
|
|
|
|
|
|
( |
) |
|
|
|
|
|
|
|
|
|
|
( |
) |
|
|
|
|
|
U.S. government agency securities |
|
|
|
|
|
|
|
|
|
|
|
|
|
|
|
|
|
|
|
|
|
|
|
|
|
Mortgage backed securities |
|
|
|
|
|
|
|
|
|
|
|
|
|
|
|
|
|
|
|
|
|
|
|
|
|
U.S. treasuries |
|
|
|
|
|
|
|
|
|
|
|
|
|
|
|
|
|
|
|
|
|
|
|
|
|
Total current investments |
|
|
|
|
|
|
|
|
|
|
|
|
|
|
|
|
|
|
|
|
|
|
|
|
|
Restricted cash and investments (1): |
|
|
|
|
|
|
|
|
|
|
|
|
|
|
|
|
|
|
|
|
|
|
|
|
|
Corporate bonds |
|
|
|
|
|
|
|
|
|
|
|
|
|
|
|
|
|
|
|
|
|
|
|
|
|
Mortgage backed securities |
|
|
|
|
|
|
|
|
|
|
|
|
|
|
|
|
|
|
|
|
|
|
|
|
|
Money market funds |
|
|
|
|
|
|
( |
) |
|
|
|
|
|
|
|
|
|
|
— |
|
|
|
|
|
|
U.S. government agency securities |
|
|
|
|
|
|
|
|
|
|
|
|
|
|
|
|
|
|
|
|
|
|
|
|
|
Mutual funds |
|
|
|
|
|
|
— |
|
|
|
|
|
|
|
|
|
|
|
— |
|
|
|
|
|
|
Supranational bonds |
|
|
|
|
|
|
|
|
|
|
|
|
|
|
|
|
|
|
|
|
|
|
|
|
|
U.S. treasuries |
|
|
|
|
|
|
|
|
|
|
|
|
|
|
|
|
|
|
|
|
|
|
|
|
|
Asset backed securities |
|
|
|
|
|
|
|
|
|
|
|
|
|
|
|
|
|
|
— |
|
|
|
|
|
|
Total restricted cash and investments |
|
|
|
|
|
|
|
|
|
|
|
|
|
|
|
|
|
|
|
|
|
|
|
|
|
Total investments |
|
$ |
|
|
|
$ |
|
|
|
$ |
|
|
|
$ |
|
|
|
$ |
|
|
|
$ |
|
|
(1) Included in restricted cash and investments within the consolidated balance sheets as of December 31, 2020 and 2019 is restricted cash of $
49
The following table summarizes the Company's investments at December 31, 2020 and 2019 measured at fair value on a recurring basis by fair value hierarchy level (in thousands):
|
|
|
December 31, 2020 |
|
|
December 31, 2019 |
|
||||||||||||||||||||||||||||||||||
|
|
|
Total |
|
|
|
|
|
|
|
|
|
|
|
|
|
|
|
|
|
|
Total |
|
|
|
|
|
|
|
|
|
|
|
|
|
|
|
|
|
||
|
|
|
Recorded |
|
|
|
|
|
|
|
|
|
|
|
|
|
|
|
|
|
|
Recorded |
|
|
|
|
|
|
|
|
|
|
|
|
|
|
|
|
|
||
|
|
|
Basis |
|
|
Level 1 |
|
|
Level 2 |
|
|
Level 3 |
|
|
Other (1) |
|
|
Basis |
|
|
Level 1 |
|
|
Level 2 |
|
|
Level 3 |
|
|
Other (1) |
|
||||||||||
|
Cash equivalents: |
|
|
|
|
|
|
|
|
|
|
|
|
|
|
|
|
|
|
|
|
|
|
|
|
|
|
|
|
|
|
|
|
|
|
|
|
|
|
|
|
|
Money market funds |
|
$ |
|
|
|
$ |
— |
|
|
$ |
— |
|
|
$ |
— |
|
|
$ |
|
|
|
$ |
|
|
|
$ |
— |
|
|
$ |
— |
|
|
$ |
— |
|
|
$ |
|
|
|
Investments: |
|
|
|
|
|
|
|
|
|
|
|
|
|
|
|
|
|
|
|
|
|
|
|
|
|
|
|
|
|
|
|
|
|
|
|
|
|
|
|
|
|
Corporate bonds |
|
|
|
|
|
|
— |
|
|
|
|
|
|
|
— |
|
|
|
— |
|
|
|
|
|
|
|
— |
|
|
|
|
|
|
|
— |
|
|
|
— |
|
|
Asset backed securities |
|
|
|
|
|
|
— |
|
|
|
|
|
|
|
— |
|
|
|
— |
|
|
|
|
|
|
|
— |
|
|
|
|
|
|
|
— |
|
|
|
— |
|
|
U.S. government agency securities |
|
|
|
|
|
|
— |
|
|
|
|
|
|
|
— |
|
|
|
— |
|
|
|
|
|
|
|
— |
|
|
|
|
|
|
|
— |
|
|
|
— |
|
|
Mortgage backed securities |
|
|
|
|
|
|
— |
|
|
|
|
|
|
|
— |
|
|
|
— |
|
|
|
|
|
|
|
— |
|
|
|
|
|
|
|
— |
|
|
|
— |
|
|
U.S. treasuries |
|
|
|
|
|
|
— |
|
|
|
|
|
|
|
— |
|
|
|
— |
|
|
|
|
|
|
|
— |
|
|
|
|
|
|
|
— |
|
|
|
— |
|
|
Restricted cash and investments: |
|
|
|
|
|
|
|
|
|
|
|
|
|
|
|
|
|
|
|
|
|
|
|
|
|
|
|
|
|
|
|
|
|
|
|
|
|
|
|
|
|
Corporate bonds |
|
|
|
|
|
|
— |
|
|
|
|
|
|
|
— |
|
|
|
— |
|
|
|
|
|
|
|
— |
|
|
|
|
|
|
|
— |
|
|
|
— |
|
|
Mortgage backed securities |
|
|
|
|
|
|
— |
|
|
|
|
|
|
|
— |
|
|
|
— |
|
|
|
|
|
|
|
— |
|
|
|
|
|
|
|
— |
|
|
|
— |
|
|
Money market funds |
|
|
|
|
|
|
— |
|
|
|
— |
|
|
|
— |
|
|
|
|
|
|
|
|
|
|
|
— |
|
|
|
— |
|
|
|
— |
|
|
|
|
|
|
U.S. government agency securities |
|
|
|
|
|
|
— |
|
|
|
|
|
|
|
— |
|
|
|
— |
|
|
|
|
|
|
|
— |
|
|
|
|
|
|
|
— |
|
|
|
— |
|
|
Mutual funds |
|
|
|
|
|
|
|
|
|
|
— |
|
|
|
— |
|
|
|
— |
|
|
|
|
|
|
|
|
|
|
|
— |
|
|
|
— |
|
|
|
— |
|
|
Supranational bonds |
|
|
|
|
|
|
— |
|
|
|
|
|
|
|
— |
|
|
|
— |
|
|
|
|
|
|
|
— |
|
|
|
|
|
|
|
— |
|
|
|
— |
|
|
U.S. treasuries |
|
|
|
|
|
|
— |
|
|
|
|
|
|
|
— |
|
|
|
— |
|
|
|
|
|
|
|
— |
|
|
|
|
|
|
|
— |
|
|
|
— |
|
|
Asset backed securities |
|
|
|
|
|
|
— |
|
|
|
|
|
|
|
— |
|
|
|
— |
|
|
|
|
|
|
|
— |
|
|
|
|
|
|
|
— |
|
|
|
— |
|
|
Total investments |
|
$ |
|
|
|
$ |
|
|
|
$ |
|
|
|
$ |
— |
|
|
$ |
|
|
|
$ |
|
|
|
$ |
|
|
|
$ |
|
|
|
$ |
— |
|
|
$ |
|
|
(1) Investments in money market funds measured at fair value using the net asset value per share practical expedient are not subject to hierarchy level classification disclosure. The Company invests in money market funds that seek to maintain a stable net asset value. These investments include commingled funds that comprise high-quality short-term securities representing liquid debt and monetary instruments where the redemption value is likely to be the fair value. Redemption is permitted daily without written notice.
50
The following table summarizes the contractual maturities of the Company’s available for sale securities at December 31, 2020 and 2019. Actual maturities may differ from contractual maturities because borrowers may have the right to prepay obligations with or without prepayment penalties.
|
|
December 31, 2020 |
|
|||||||||||||||||
|
(In thousands) |
Less than 1 Year |
|
|
Between 1 to 5 Years |
|
|
Between 5 to 10 Years |
|
|
After 10 Years |
|
|
Total |
|
|||||
|
Corporate bonds |
$ |
|
|
|
$ |
|
|
|
$ |
|
|
|
$ |
— |
|
|
$ |
|
|
|
Money market funds |
|
|
|
|
|
— |
|
|
|
— |
|
|
|
— |
|
|
|
|
|
|
U.S. government agency securities |
|
|
|
|
|
|
|
|
|
|
|
|
|
— |
|
|
|
|
|
|
Asset backed securities |
|
|
|
|
|
|
|
|
|
— |
|
|
|
|
|
|
|
|
|
|
Supranational bonds |
|
|
|
|
|
— |
|
|
|
— |
|
|
|
— |
|
|
|
|
|
|
U.S. treasuries |
|
|
|
|
|
|
|
|
|
|
|
|
|
— |
|
|
|
|
|
|
Total |
$ |
|
|
|
$ |
|
|
|
$ |
|
|
|
$ |
|
|
|
$ |
|
|
|
|
|
|
|
|
|
|
|
|
|
|
|
|
|
|
|
|
|
|
|
|
|
December 31, 2019 |
|
|||||||||||||||||
|
(In thousands) |
Less than 1 Year |
|
|
Between 1 to 5 Years |
|
|
Between 5 to 10 Years |
|
|
After 10 Years |
|
|
Total |
|
|||||
|
Corporate bonds |
$ |
|
|
|
$ |
|
|
|
$ |
|
|
|
$ |
— |
|
|
$ |
|
|
|
Money market funds |
|
|
|
|
|
— |
|
|
|
— |
|
|
|
— |
|
|
|
|
|
|
U.S. government agency securities |
|
|
|
|
|
|
|
|
|
|
|
|
|
— |
|
|
|
|
|
|
U.S. treasuries |
|
|
|
|
|
|
|
|
|
— |
|
|
|
— |
|
|
|
|
|
|
Asset backed securities |
|
— |
|
|
|
|
|
|
|
— |
|
|
|
|
|
|
|
|
|
|
Supranational bonds |
|
— |
|
|
|
|
|
|
|
— |
|
|
|
— |
|
|
|
|
|
|
Total |
$ |
|
|
|
$ |
|
|
|
$ |
|
|
|
$ |
|
|
|
$ |
|
|
The average contractual maturity of mortgage backed securities, which are excluded from the table above, was
Note 4 - Property, Equipment and Software
Property, equipment and software consists of the following (in thousands):
|
|
|
|
|
|
|
|
|
|
|
|
|
December 31, |
|
|||||
|
|
|
2020 |
|
|
2019 |
|
||
|
Buildings |
|
$ |
|
|
|
$ |
|
|
|
Office furniture and fixtures |
|
|
|
|
|
|
|
|
|
Computer hardware and software |
|
|
|
|
|
|
|
|
|
Software development costs |
|
|
|
|
|
|
|
|
|
Other |
|
|
|
|
|
|
|
|
|
|
|
|
|
|
|
|
|
|
|
Less accumulated depreciation and amortization |
|
|
( |
) |
|
|
( |
) |
|
|
|
|
|
|
|
|
|
|
|
Land |
|
|
|
|
|
|
|
|
|
|
|
$ |
|
|
|
$ |
|
|
We recognized $
51
Note 5 - Workers' Compensation Claims
The following table summarizes the aggregate workers' compensation reserve activity (in thousands):
|
|
|
|
Years Ended December 31, |
|
|||||||||
|
|
|
|
2020 |
|
|
2019 |
|
|
2018 |
|
|||
|
Beginning balance |
|
|
|
|
|
|
|
|
|
|
|
|
|
|
Workers' compensation claims liabilities |
|
|
$ |
|
|
|
$ |
|
|
|
$ |
|
|
|
Add: claims expense accrual |
|
|
|
|
|
|
|
|
|
|
|
|
|
|
Current period |
|
|
|
|
|
|
|
|
|
|
|
|
|
|
Prior periods |
|
|
|
( |
) |
|
|
( |
) |
|
|
( |
) |
|
|
|
|
|
|
|
|
|
|
|
|
|
|
|
|
Less: claim payments related to |
|
|
|
|
|
|
|
|
|
|
|
|
|
|
Current period |
|
|
|
|
|
|
|
|
|
|
|
|
|
|
Prior periods |
|
|
|
|
|
|
|
|
|
|
|
|
|
|
|
|
|
|
|
|
|
|
|
|
|
|
|
|
|
Change in claims incurred in excess of retention limits |
|
|
|
( |
) |
|
|
|
|
|
|
|
|
|
Ending balance |
|
|
|
|
|
|
|
|
|
|
|
|
|
|
Workers' compensation claims liabilities |
|
|
$ |
|
|
|
$ |
|
|
|
$ |
|
|
|
Incurred but not reported (IBNR) |
|
|
$ |
|
|
|
$ |
|
|
|
$ |
|
|
|
|
|
|
|
|
|
|
|
|
|
|
|
|
|
|
Ratio of IBNR to workers' compensation claims liabilities |
|
|
|
|
% |
|
|
|
% |
|
|
|
% |
The Company is a self-insured employer with respect to workers' compensation coverage for all of its employees (including employees co-employed through our client service agreements) working in Colorado, Maryland and Oregon. In the state of Washington, state law allows only the Company's staffing services and internal management employees to be covered under the Company's self-insured workers' compensation program. The Company also operates a wholly owned, fully licensed insurance company, Ecole, which provides workers’ compensation coverage to the Company’s employees working in Arizona and Utah.
For all other clients, the Company obtains policies from Chubb Limited (“Chubb”) through an arrangement known as a fronted program, which provides a licensed, admitted insurance carrier to issue policies on behalf of the Company. Chubb assumes credit risk should the Company be unable to satisfy its indemnification obligations.
Through various insurance arrangements, the Company retains risk of loss up to the first $
The fronted program with Chubb requires that collateral be advanced at the inception of the policy term. To partially satisfy these collateral requirements, the Company provided a letter of credit of $
In addition, the Company makes monthly collateral payments into trust accounts (the “Chubb trust accounts”) for the fronted program. The balance in the Chubb trust accounts was $
The states of California, Maryland, Oregon, Washington, Colorado and Delaware required us to maintain collateral totaling $
52
On June 29, 2020, the Company entered into a loss portfolio transfer agreement to remove all outstanding workers’ compensation claims obligations for claims incurred under its fronted insurance program between February 1, 2014 and December 31, 2017. This transaction reduced the Company’s outstanding workers’ compensation liabilities and Chubb trust account balances by $
The Company provided a total of $
Note 6 - Revolving Credit Facility and Long-Term Debt
On September 30, 2020, the Company entered into an amended credit agreement (the “Agreement”) with the Bank, which reverted to the provisions set forth in the agreement prior to May 15, 2020. The Agreement reduced the revolving credit line from $
Advances under the revolving credit line bear interest, as selected by the Company, of (a)
The Agreement also provides for a $
The initial fee paid under the Chubb Letter of Credit in June 2018 was equal to
The Agreement requires the satisfaction of certain financial covenants as follows:
|
|
• |
EBITDA [net income before taxes plus interest expense (net of capitalized interest expense), depreciation expense, and amortization expense] on a rolling four-quarter basis must be not less than $ |
|
|
• |
the ratio of restricted and unrestricted cash and investments to workers’ compensation and safety incentive liabilities must be at least , measured quarterly. |
53
|
|
The Agreement imposes certain additional restrictions unless the Bank provides its prior written consent as follows:
|
|
• |
incurring additional indebtedness is prohibited, other than purchase financing for the acquisition of assets, provided that the aggregate of all purchase financing does not exceed $ |
|
|
• |
the Company may not terminate or cancel any of the AICE policies; and |
|
|
• |
if an event of default would occur, including on a pro forma basis, |
The Agreement also contains customary events of default and specified cross-defaults under the Company's workers' compensation insurance arrangements. If an event of default under the Agreement occurs and is continuing, the Bank may declare any outstanding obligations under the Agreement to be immediately due and payable. At December 31, 2020, the Company was in compliance with all covenants.
The Company maintains a mortgage loan with the Bank with a balance of approximately $
Note 7 – Benefit Plans
We have a 401(k) Retirement Savings Plan for the benefit of our eligible employees. Employees covered under a PEO arrangement may participate in the plan at the sole discretion of the PEO client. We make matching contributions to the 401(k) plan under a safe harbor provision. The determination of any discretionary Company contributions to the plan is at the sole discretion of our Board of Directors.
The Company allows certain highly compensated employees of the Company to defer compensation under a nonqualified deferred compensation plan. The long-term portion of the deferred compensation plan liability was $
54
Note 8 – Leases
Effective January 1, 2019, the Company adopted Accounting Standards Codification (“ASC”) Topic 842 “Leases” using the optional transition method. Under this method of adoption, the prior period comparative information in the consolidated financial statements has not been revised and continues to be reported under the previously applicable lease accounting guidance. Additionally, we elected the package of practical expedients permitted under the transition guidance, which included the carry-forward of historical lease classification.
The Company primarily leases office buildings under operating leases which are included in Operating lease right-of-use (“ROU”) assets, Current operating lease liabilities, and Long-term operating lease liabilities on the consolidated balance sheets. The Company’s leases have remaining terms of
Information related to the Company's total lease costs were as follows (in thousands):
|
|
Year Ended |
|
|||||
|
|
December 31, 2020 |
|
|
December 31, 2019 |
|
||
|
Operating lease cost |
$ |
|
|
|
$ |
|
|
|
Variable lease cost |
|
|
|
|
|
|
|
|
Short-term lease cost |
|
|
|
|
|
|
|
|
Total lease cost |
$ |
|
|
|
$ |
|
|
As previously disclosed in our 2018 Annual Report on Form 10-K and under the previous lease accounting, rental expense for the year ended December 31, 2018 was $
Information related to the Company's ROU assets and related lease liabilities were as follows (in thousands):
|
|
Year Ended |
|
|
|||||
|
|
December 31, 2020 |
|
|
December 31, 2019 |
|
|
||
|
Cash paid for operating lease liabilities |
$ |
|
|
|
$ |
|
|
|
|
Right-of-use assets obtained in exchange for new operating lease obligations (1) |
|
|
|
|
|
|
|
|
|
|
|
|
|
|
|
|
|
|
|
(1) The 2019 year-end balance includes $ |
|
|
||||||
|
|
|
|
|
|
|
|
|
|
|
|
December 31, 2020 |
|
|
December 31, 2019 |
|
|
||
|
Weighted-average remaining lease term |
|
|
|
|
|
|
||
|
Weighted-average discount rate |
|
|
% |
|
|
% |
||
55
The table below reconciles the undiscounted future minimum lease payments (displayed by year and in the aggregate) under noncancellable operating leases with terms of more than one year to the total operating lease liabilities recognized on the consolidated balance sheets as of December 31, 2020 (in thousands):
|
2021 |
$ |
|
|
|
2022 |
|
|
|
|
2023 |
|
|
|
|
2024 |
|
|
|
|
2025 |
|
|
|
|
Thereafter |
|
|
|
|
Total undiscounted future minimum lease payments |
|
|
|
|
Less: Difference between undiscounted lease payments and discounted operating lease liabilities |
|
|
|
|
Total operating lease liabilities |
$ |
|
|
|
Current operating lease liabilities |
$ |
|
|
|
Long-term operating lease liabilities |
|
|
|
|
Total operating lease liabilities |
$ |
|
|
The Company has additional operating leases of $
Note 9 - Income Taxes
The provision for income taxes is as follows (in thousands):
|
|
|
Year Ended December 31, |
|
|||||||||
|
|
|
2020 |
|
|
2019 |
|
|
2018 |
|
|||
|
Current: |
|
|
|
|
|
|
|
|
|
|
|
|
|
Federal |
|
$ |
|
|
|
$ |
|
|
|
$ |
|
|
|
State |
|
|
|
|
|
|
|
|
|
|
|
|
|
|
|
|
|
|
|
|
|
|
|
|
|
|
|
Deferred: |
|
|
|
|
|
|
|
|
|
|
|
|
|
Federal |
|
|
|
|
|
|
( |
) |
|
|
( |
) |
|
State |
|
|
|
|
|
|
|
|
|
|
( |
) |
|
|
|
|
|
|
|
|
|
|
|
|
( |
) |
|
Total provision |
|
$ |
|
|
|
$ |
|
|
|
$ |
|
|
56
Deferred income tax assets and liabilities consist of the following components (in thousands):
|
|
|
December 31, |
|
|||||
|
|
|
2020 |
|
|
2019 |
|
||
|
Deferred income tax assets: |
|
|
|
|
|
|
|
|
|
Workers' compensation claims liabilities |
|
$ |
|
|
|
$ |
|
|
|
Operating lease liability |
|
|
|
|
|
|
|
|
|
Deferred compensation |
|
|
|
|
|
|
|
|
|
Payroll tax deferral |
|
|
|
|
|
|
— |
|
|
Other |
|
|
|
|
|
|
|
|
|
MCC accrual |
|
|
|
|
|
|
|
|
|
Equity based compensation |
|
|
|
|
|
|
|
|
|
State credit carryforward |
|
|
|
|
|
|
|
|
|
Customer incentives |
|
|
|
|
|
|
|
|
|
State loss carryforward |
|
|
— |
|
|
|
|
|
|
|
|
|
|
|
|
|
|
|
|
Less: valuation allowance |
|
|
|
|
|
|
|
|
|
|
|
|
|
|
|
|
|
|
|
Deferred income tax liabilities: |
|
|
|
|
|
|
|
|
|
Tax amortization of goodwill |
|
|
( |
) |
|
|
( |
) |
|
Tax depreciation in excess of book depreciation |
|
|
( |
) |
|
|
( |
) |
|
Operating lease right-of-use |
|
|
( |
) |
|
|
( |
) |
|
Tax effect of unrealized gains, net |
|
|
( |
) |
|
|
( |
) |
|
Other |
|
|
( |
) |
|
|
( |
) |
|
|
|
|
( |
) |
|
|
( |
) |
|
Net deferred income taxes |
|
$ |
( |
) |
|
$ |
|
|
The effective tax rate differed from the U.S. statutory federal tax rate due to the following:
|
|
|
Year Ended December 31, |
|
|
|||||||||||
|
|
|
2020 |
|
|
|
2019 |
|
|
|
2018 |
|
|
|||
|
Statutory federal tax rate |
|
|
|
|
% |
|
|
|
|
% |
|
|
|
|
% |
|
State taxes, net of federal benefit |
|
|
|
|
|
|
|
|
|
|
|
|
|
|
|
|
Adjustment for final positions on filed returns |
|
|
|
|
|
|
|
( |
) |
|
|
|
( |
) |
|
|
Nondeductible expenses and other, net |
|
|
|
|
|
|
|
|
|
|
|
|
|
|
|
|
Federal and state tax credits |
|
|
( |
) |
|
|
|
( |
) |
|
|
|
( |
) |
|
|
Other, net |
|
|
|
|
|
|
|
|
|
|
|
|
— |
|
|
|
|
|
|
|
|
% |
|
|
|
|
% |
|
|
|
|
% |
|
|
|
|
|
|
|
|
|
|
|
|
|
|
|
|
|
57
Under ASC 740, “Income Taxes,” management evaluates the realizability of the deferred tax assets on a quarterly basis under a “more-likely than not” standard. As part of this evaluation, management reviews all evidence both positive and negative to determine if a valuation allowance is needed. One component of this analysis is to determine whether the Company was in a cumulative loss position for the most recent 12 quarters. The Company was in a cumulative income position for the 12 quarters ended at both December 31, 2020 and December 31, 2019.
The Company’s realization of a portion of net deferred tax assets is based in part on our estimates of the timing of reversals of certain temporary differences and on the generation of taxable income before such reversals.
The Company is subject to income taxes in U.S. federal and multiple state and local tax jurisdictions. The Internal Revenue Service is examining the Company’s federal tax returns for the years ended December 31, 2011, 2012, 2013 and 2014. In July 2020, BBSI received a draft Revenue Agent Report in relation to the ongoing IRS audit for tax years
In the major jurisdictions where it operates, the Company is generally no longer subject to income tax examinations by tax authorities for the 2015 and 2016 tax year and tax years before 2011. As of December 31, 2020, 2019 and 2018, the Company had no material unrecognized tax benefits.
A portion of the consolidated income the Company generates is not subject to state income tax. Depending on the percentage of this income as compared to total consolidated income, the Company's state effective tax rate could fluctuate from expectations.
At December 31, 2020, the Company had an immaterial amount of state operating loss carryforwards. At December 31, 2020, the Company did
Note 10 - Stock Incentive Plans
The Company's 2020 Stock Incentive Plan (the "2020 Plan"), which provides for share-based awards to Company employees, non-employee directors and outside consultants or advisors, was approved by stockholders on May 27, 2020. The number of shares of common stock reserved for issuance under the 2020 Plan is
Share-based compensation expense included in selling, general and administrative expenses during the years ended December 31, 2020, 2019 and 2018, was $
58
Stock Options
Outstanding stock options generally vest over either four or
A summary of the status of the Company’s stock options at December 31, 2020, together with changes during the periods then ended, is presented below:
|
|
|
|
|
|
|
|
|
|
|
Weighted |
|
|
|
|
|
|
|
|
|
|
|
|
|
Weighted |
|
|
Average |
|
|
Aggregate |
|
|||
|
|
|
|
|
|
|
Average |
|
|
Remaining |
|
|
Intrinsic |
|
|||
|
|
|
Number |
|
|
Exercise |
|
|
Contractual |
|
|
Value |
|
||||
|
|
|
of Options |
|
|
Price |
|
|
Term (Years) |
|
|
(In Thousands) |
|
||||
|
Outstanding at December 31, 2019 |
|
|
|
|
|
$ |
|
|
|
|
— |
|
|
|
— |
|
|
Options exercised |
|
|
( |
) |
|
|
|
|
|
|
— |
|
|
|
— |
|
|
Options cancelled |
|
|
( |
) |
|
|
|
|
|
|
— |
|
|
|
— |
|
|
Outstanding at December 31, 2020 |
|
|
|
|
|
|
|
|
|
|
|
|
|
|
|
|
|
Exercisable at December 31, 2020 |
|
|
|
|
|
$ |
|
|
|
|
|
|
|
$ |
|
|
The fair value of stock option awards as determined under the Black-Scholes option-pricing model was estimated with the following weighted-average assumptions:
|
|
|
2018 |
|
||
|
Expected volatility |
|
|
|
|
% |
|
Risk free interest rate |
|
|
|
|
% |
|
Expected dividend yield |
|
|
|
|
% |
|
Expected term |
|
|
|
|
|
|
Weighted average fair value per share |
|
$ |
|
|
|
The intrinsic value of stock options exercised for the years ended December 31, 2020, 2019 and 2018 was $
59
Restricted Stock Units
Restricted stock units generally vest in
The following table presents restricted stock unit activity:
|
|
|
|
|
|
|
Weighted Average |
|
|
|
|
|
|
|
|
|
Grant Date |
|
|
|
|
|
Units |
|
|
Fair Value |
|
||
|
Nonvested at December 31, 2019 |
|
|
|
|
|
$ |
|
|
|
Granted |
|
|
|
|
|
|
|
|
|
Vested |
|
|
( |
) |
|
|
|
|
|
Cancelled/Forfeited |
|
|
( |
) |
|
|
|
|
|
Nonvested at December 31, 2020 |
|
|
|
|
|
$ |
|
|
The total fair value of restricted stock units vested during the years ended December 31, 2020, 2019 and 2018 was $
Performance Share Units
Performance share units (“PSUs”) are granted to key employees of the Company and are conditioned on attaining specified financial performance metrics. Awards are subject to upward or downward adjustments depending on whether the actual financial metrics are above or below the target level, with a maximum payout up to
PSUs fully vest on the date that the Compensation Committee determines the level of attainment of specified performance goals, generally over a period.
The following table presents PSU activity:
|
|
|
|
|
|
|
Weighted Average |
|
|
|
|
|
|
|
|
|
Grant Date |
|
|
|
|
|
Units |
|
|
Fair Value |
|
||
|
Nonvested at December 31, 2019 |
|
|
|
|
|
$ |
|
|
|
Vested |
|
|
( |
) |
|
|
|
|
|
Cancelled/Forfeited |
|
|
( |
) |
|
|
|
|
|
Nonvested at December 31, 2020 |
|
|
|
|
|
$ |
|
|
The total fair value of PSUs vested during the years ended December 31, 2020 and 2019 was $
Employee Stock Purchase Plan
The Company offers employees the right to purchase shares at a discount from the market price under the Company’s 2019 Employee Stock Purchase Plan. Subject to the annual statutory limit, employees are eligible to participate through payroll deductions of up to
60
Note 11 - Stock Repurchase Program
The Company maintains a stock repurchase program approved by the Board of Directors, which authorizes the repurchase of shares from time to time in open market purchases. On August 6, 2019, the Board of Directors authorized the repurchase of up to $
Note 12 - Litigation
On November 21, 2012, David Kaanaana (“Kaanaana”), a former staffing employee, filed a California wage and hour violations lawsuit against BBSI. On May 19, 2016, the court entered a ruling in favor of BBSI, which was subsequently appealed by the plaintiffs. On November 30, 2018, the California Court of Appeal for the Second Appellate District returned its decision in Kaanaana v. Barrett Business Services, Inc., overruling the trial court's decision to dismiss plaintiffs' claims and holding that prevailing wage requirements applicable to “public works” apply to certain types of districts. On January 9, 2019, BBSI filed a petition of review to the California Supreme Court. An amicus letter in support of the petition was filed by the Sanitation Districts of Los Angeles County, joined in by numerous other "special districts" in California.
On February 27, 2019, the California Supreme Court granted the petition to review the appellate court’s decision, and oral argument took place on January 5, 2021. A decision from the California Supreme Court is pending.
BBSI is subject to other legal proceedings and claims that arise in the ordinary course of our business. Given the uncertainties surrounding litigation, management is unable to estimate a potential range of loss arising from these actions.
Note 13 - Quarterly Financial Information (Unaudited)
(in thousands, except per share amounts)
|
|
|
Quarter Ended |
|
|||||||||||||
|
|
|
March 31 |
|
|
June 30 |
|
|
September 30 |
|
|
December 31 |
|
||||
|
Year ended December 31, 2020 |
|
|
|
|
|
|
|
|
|
|
|
|
|
|
|
|
|
Revenues |
|
$ |
|
|
|
$ |
|
|
|
$ |
|
|
|
$ |
|
|
|
Cost of revenues |
|
|
|
|
|
|
|
|
|
|
|
|
|
|
|
|
|
Gross margin |
|
|
|
|
|
|
|
|
|
|
|
|
|
|
|
|
|
Net (loss) income |
|
|
( |
) |
|
|
|
|
|
|
|
|
|
|
|
|
|
Basic (loss) income per common share |
|
|
( |
) |
|
|
|
|
|
|
|
|
|
|
|
|
|
Diluted (loss) income per common share |
|
|
( |
) |
|
|
|
|
|
|
|
|
|
|
|
|
|
|
|
|
|
|
|
|
|
|
|
|
|
|
|
|
|
|
|
Year ended December 31, 2019 |
|
|
|
|
|
|
|
|
|
|
|
|
|
|
|
|
|
Revenues |
|
$ |
|
|
|
$ |
|
|
|
$ |
|
|
|
$ |
|
|
|
Cost of revenues |
|
|
|
|
|
|
|
|
|
|
|
|
|
|
|
|
|
Gross margin |
|
|
|
|
|
|
|
|
|
|
|
|
|
|
|
|
|
Net (loss) income |
|
|
( |
) |
|
|
|
|
|
|
|
|
|
|
|
|
|
Basic (loss) income per common share |
|
|
( |
) |
|
|
|
|
|
|
|
|
|
|
|
|
|
Diluted (loss) income per common share |
|
|
( |
) |
|
|
|
|
|
|
|
|
|
|
|
|
Note 14 - Subsequent Events
We have evaluated events and transactions occurring after the balance sheet date through our filing date and noted no events that are subject to recognition or disclosure.
61
|
Item 9. |
CHANGES IN AND DISAGREEMENTS WITH ACCOUNTANTS ON ACCOUNTING AND FINANCIAL DISCLOSURE |
None.
|
Item 9A. |
CONTROLS AND PROCEDURES |
Evaluation of Disclosure Controls and Procedures
We maintain “disclosure controls and procedures” that are designed with the objective of providing reasonable assurance that information required to be disclosed in the reports we file or submit under the Securities Exchange Act of 1934, as amended (the “Exchange Act”), is recorded, processed, summarized, and reported within the time periods specified in the SEC’s rules and forms, and that such information is accumulated and communicated to our management, including our Chief Executive Officer (“CEO”) and Chief Financial Officer (“CFO”), as appropriate, to allow timely decisions regarding required disclosure. In designing and evaluating our disclosure controls and procedures, our management recognizes that any controls and procedures, no matter how well designed and operated, can provide only reasonable assurance of achieving the desired control objectives, and our management is required to apply their judgment in evaluating the cost-benefit relationship of possible controls and procedures.
Based on their evaluation, the Company’s CEO and CFO have concluded that the Company’s disclosure controls and procedures (as defined in Rules 13a-15(e) and 15d-15(e) under the Exchange Act) were effective as of December 31, 2020.
Annual Report on Internal Control over Financial Reporting
Management is responsible for establishing and maintaining adequate internal control over financial reporting (“ICFR”) as defined in Rules 13a-15(f) and 15d-15(f) under the Exchange Act. Our ICFR is a process designed by, or under the supervision of, our CEO and our CFO to provide reasonable assurance regarding the reliability of financial reporting and the preparation of our consolidated financial statements for external purposes in accordance with generally accepted accounting principles (“GAAP”) in the United States of America. Management, with the participation of our CEO and CFO, conducted an evaluation of the effectiveness of our ICFR based on the framework established in Internal Control—Integrated Framework (2013) issued by the Committee of Sponsoring Organizations of the Treadway Commission. Based upon that evaluation, management has concluded that the Company’s internal control over financial reporting was effective as of December 31, 2020.
The effectiveness of the Company’s internal control over financial reporting has also been audited by Deloitte & Touche LLP, the Company’s independent registered public accounting firm, as stated in their report included below.
62
Changes in Internal Control over Financial Reporting
There have been no changes in the Company’s internal control over financial reporting that occurred during the quarter ended December 31, 2020 that have materially affected, or are reasonably likely to materially affect, the Company’s internal control over financial reporting.
Inherent Limitations
Control systems, no matter how well designed and operated, can provide only reasonable, not absolute, assurance that the control systems' objectives are being met. Further, the design of any control systems must reflect the fact that there are resource constraints, and the benefits of all controls must be considered relative to their costs. Due to the inherent limitations in all control systems, no evaluation of controls can provide absolute assurance that all control issues and instances of fraud, if any, within the Company have been detected. These inherent limitations include the realities that judgments in decision making can be faulty and that breakdowns can occur because of simple errors or mistakes. Control systems can also be circumvented by the individual acts of some persons, by collusion of two or more people, or by management override of the controls. The design of any system of controls is based in part on certain assumptions about the likelihood of future events, and there can be no assurance that any design will succeed in achieving its stated goals under all potential future conditions. Over time, controls may become inadequate because of changes in conditions or deterioration in the degree of compliance with policies or procedures.
Chief Executive Officer and Chief Financial Officer Certifications
The certifications of our CEO and CFO required under Section 302 of the Sarbanes-Oxley Act have been filed as Exhibits 31.1 and 31.2 to this report.
63
REPORT OF INDEPENDENT REGISTERED PUBLIC ACCOUNTING FIRM
To the Stockholders and the Board of Directors of
Barrett Business Services, Inc.
Vancouver, Washington
Opinion on Internal Control over Financial Reporting
We have audited the internal control over financial reporting of Barrett Business Services, Inc. and subsidiaries (the “Company”) as of December 31, 2020, based on criteria established in Internal Control—Integrated Framework (2013) issued by the Committee of Sponsoring Organizations of the Treadway Commission (COSO). In our opinion, the Company maintained, in all material respects, effective internal control over financial reporting as of December 31, 2020, based on criteria established in Internal Control—Integrated Framework (2013) issued by COSO.
We have also audited, in accordance with the standards of the Public Company Accounting Oversight Board (United States) (PCAOB), the consolidated financial statements as of and for the year ended December 31, 2020, of the Company and our report dated March 8, 2021, expressed an unqualified opinion on those financial statements.
Basis for Opinion
The Company’s management is responsible for maintaining effective internal control over financial reporting and for its assessment of the effectiveness of internal control over financial reporting, included in the accompanying Management’s Report over Internal Control over Financial Reporting. Our responsibility is to express an opinion on the Company’s internal control over financial reporting based on our audit. We are a public accounting firm registered with the PCAOB and are required to be independent with respect to the Company in accordance with the U.S. federal securities laws and the applicable rules and regulations of the Securities and Exchange Commission and the PCAOB.
We conducted our audit in accordance with the standards of the PCAOB. Those standards require that we plan and perform the audit to obtain reasonable assurance about whether effective internal control over financial reporting was maintained in all material respects. Our audit included obtaining an understanding of internal control over financial reporting, assessing the risk that a material weakness exists, testing and evaluating the design and operating effectiveness of internal control based on the assessed risk, and performing such other procedures as we considered necessary in the circumstances. We believe that our audit provides a reasonable basis for our opinion.
Definition and Limitations of Internal Control over Financial Reporting
A company’s internal control over financial reporting is a process designed to provide reasonable assurance regarding the reliability of financial reporting and the preparation of financial statements for external purposes in accordance with generally accepted accounting principles. A company’s internal control over financial reporting includes those policies and procedures that (1) pertain to the maintenance of records that, in reasonable detail, accurately and fairly reflect the transactions and dispositions of the assets of the company; (2) provide reasonable assurance that transactions are recorded as necessary to permit preparation of financial statements in accordance with generally accepted accounting principles, and that receipts and expenditures of the company are being made only in accordance with authorizations of management and directors of the company; and (3) provide reasonable assurance regarding prevention or timely detection of unauthorized acquisition, use, or disposition of the company’s assets that could have a material effect on the financial statements.
Because of its inherent limitations, internal control over financial reporting may not prevent or detect misstatements. Also, projections of any evaluation of effectiveness to future periods are subject to the risk that controls may become inadequate because of changes in conditions, or that the degree of compliance with the policies or procedures may deteriorate.
/s/ Deloitte & Touche LLP
Portland, Oregon
March 8, 2021
64
|
Item 9B. |
OTHER INFORMATION |
None.
|
Item 10. |
DIRECTORS, EXECUTIVE OFFICERS AND CORPORATE GOVERNANCE |
Information required by this item is incorporated by reference to the information set forth under the captions "Item 1-Election of Directors," "Stock Ownership of Principal Stockholders and Management-Delinquent Section 16(a) Reports," “Background and Experience of Executive Officers” and "Code of Ethics" in our definitive Proxy Statement to be filed with the Securities and Exchange Commission pursuant to Regulation 14A within 120 days after the end of the fiscal year covered by this report (the “Proxy Statement”).
|
Item 11. |
EXECUTIVE COMPENSATION |
The information required by this item is incorporated by reference to the information set forth under the captions “Director Compensation for 2020” and “Executive Compensation” in the Proxy Statement.
|
Item 12. |
SECURITY OWNERSHIP OF CERTAIN BENEFICIAL OWNERS AND MANAGEMENT AND RELATED STOCKHOLDER MATTERS |
The information required by this item is incorporated by reference to the information set forth under the caption "Stock Ownership of Principal Stockholders and Management – Beneficial Ownership Table" and “Additional Equity Compensation Plan Information” in the Proxy Statement.
|
Item 13. |
CERTAIN RELATIONSHIPS AND RELATED TRANSACTIONS, AND DIRECTOR INDEPENDENCE |
The information required by this item is incorporated by reference to the information set forth under the caption "Item 1-Election of Directors" and "Related Person Transactions" in the Proxy Statement.
|
Item 14. |
PRINCIPAL ACCOUNTANT FEES AND SERVICES |
The information required by this item is incorporated by reference to the information set forth under the caption "Matters Relating to Our Independent Registered Public Accounting Firm” in the Proxy Statement.
65
PART IV
|
Item 15. |
EXHIBITS AND FINANCIAL STATEMENT SCHEDULES |
Financial Statements and Schedules
The Financial Statements, together with the report thereon of Deloitte & Touche LLP, are included on the pages indicated below:
No schedules are required to be filed herewith.
Exhibits
The following exhibits are filed or furnished herewith or incorporated by reference and this list is intended to constitute the exhibit index.
Exhibit
|
Number |
Description |
66
67
68
|
10.34 |
Death Benefit Agreement entered into by the Registrant and James Potts effective October 30, 2020.* |
69
|
101.INS |
Inline XBRL Instance Document (the instance document does not appear in the Interactive Data File because its XBRL tags are embedded within the Inline XBRL document). |
|
101.SCH |
Inline XBRL Taxonomy Extension Schema Document. |
|
101.CAL |
Inline XBRL Taxonomy Extension Calculation Linkbase Document. |
|
101.DEF |
Inline XBRL Taxonomy Extension Definition Linkbase Document. |
|
101.LAB |
Inline XBRL Taxonomy Extension Label Linkbase Document. |
|
101.PRE |
Inline XBRL Taxonomy Extension Presentation Linkbase Document. |
|
104 |
Coverage Page Interactive Data File (embedded within the Inline XBRL document). |
|
* |
Denotes a management contract or a compensatory plan or arrangement. |
|
Item 16. |
FORM 10-K SUMMARY |
None.
70
SIGNATURES
Pursuant to the requirements of Section 13 or 15(d) of the Securities Exchange Act of 1934, the Registrant has duly caused this report to be signed on its behalf by the undersigned, thereunto duly authorized.
|
|
|
BARRETT BUSINESS SERVICES, INC. |
|
|
|
|
Registrant |
|
|
|
|
|
|
|
Date: March 8, 2021 |
|
By: |
/s/ Anthony J. Harris |
|
|
|
|
Anthony J. Harris Executive Vice President and Chief Financial Officer and Treasurer |
Pursuant to the requirements of the Securities Exchange Act of 1934, this report has been signed below by the following persons on behalf of the Registrant and in the capacities indicated on the 8th day of March, 2021.
|
Principal Executive Officer and Director: |
||
|
|
|
|
|
/s/ Gary E. Kramer |
|
President and Chief Executive Officer and Director |
|
Gary E. Kramer |
|
|
|
|
|
|
|
Principal Financial and Accounting Officer: |
||
|
|
|
|
|
/s/ Anthony J. Harris |
|
Executive Vice President and Chief Financial Officer and Treasurer |
|
Anthony J. Harris |
|
|
|
|
|
|
|
Majority of Directors: |
||
|
|
|
|
|
/s/ Thomas J. Carley |
|
Director |
|
Thomas J. Carley |
|
|
|
|
|
|
|
/s/ Thomas B. Cusick |
|
Director |
|
Thomas B. Cusick |
|
|
|
|
|
|
|
/s/ Diane L. Dewbrey |
|
Director |
|
Diane L. Dewbrey |
|
|
|
|
|
|
|
/s/ James B. Hicks |
|
Director |
|
James B. Hicks, Ph.D. |
|
|
|
|
|
|
|
/s/ Jon L. Justesen |
|
Director |
|
Jon L. Justesen |
|
|
|
|
|
|
|
/s/ Anthony Meeker |
|
Chairman of the Board and Director |
|
Anthony Meeker |
|
|
|
|
|
|
|
/s/ Vincent P. Price |
|
Director |
|
Vincent P. Price |
|
|
71