10-K: Annual report pursuant to Section 13 and 15(d)
Published on March 14, 2014
Table of Contents
UNITED STATES
SECURITIES AND EXCHANGE COMMISSION
Washington, D.C. 20549
FORM 10-K
x ANNUAL REPORT PURSUANT TO SECTION 13 OR 15(d) OF
THE SECURITIES EXCHANGE ACT OF 1934
For the fiscal year ended December 31, 2013
Commission File Number 0-21886
BARRETT BUSINESS SERVICES, INC.
(Exact name of registrant as specified in its charter)
| Maryland | 52-0812977 | |
| (State or other jurisdiction of incorporation or organization) |
(IRS Employer Identification No.) |
|
| 8100 NE Parkway Drive, Suite 200 Vancouver, Washington |
98662 | |
| (Address of principal executive offices) | (Zip Code) | |
(360) 828-0700
(Registrants telephone number, including area code)
Securities registered pursuant to Section 12(b) of the Act:
| Title of each class |
Name of each exchange on which registered |
|
| Common Stock, Par Value $0.01 Per Share |
The NASDAQ Stock Market LLC |
Securities registered pursuant to Section 12(g) of the Act: None
Indicate by check mark if the registrant is a well-known seasoned issuer, as defined in Rule 405 of the Securities Act. Yes ¨ No x
Indicate by check mark if the registrant is not required to file reports pursuant to Section 13 or Section 15(d) of the Act. Yes ¨ No x
Indicate by check mark whether the registrant: (1) has filed all reports required to be filed by Section 13 or 15(d) of the Securities Exchange Act of 1934 during the preceding 12 months (or for such shorter period that the registrant was required to file such reports), and (2) has been subject to such filing requirements for the past 90 days. Yes x No ¨
Indicate by check mark whether the registrant has submitted electronically and posted on its corporate Website, if any, every Interactive Data File required to be submitted and posted pursuant to Rule 405 of Regulation S-T (§ 232.405 of this chapter) during the preceding 12 months (or for such shorter period that the registrant was required to submit and post such files). Yes x No ¨
Indicate by check mark if disclosure of delinquent filers pursuant to Item 405 of Regulation S-K is not contained herein, and will not be contained, to the best of registrants knowledge, in definitive proxy or information statements incorporated by reference in Part III of this Form 10-K or any amendment to this Form 10-K. x
Indicate by check mark whether the registrant is a large accelerated filer, an accelerated filer, a non-accelerated filer or a smaller reporting company (as indicated by Exchange Act Rule 12b-2).
Large accelerated filer ¨ Accelerated filer x Non-accelerated filer ¨ Smaller reporting company ¨
Indicate by check mark whether the registrant is a shell company (as defined in Rule 12b-2 of the Act). Yes ¨ No x
State the aggregate market value of the common equity held by non-affiliates of the registrant: $363,038,000 at June 30, 2013
Indicate the number of shares outstanding of each of the registrants classes of common stock, as of the latest practicable date:
| Class |
Outstanding at March 3, 2014 |
|
| Common Stock, Par Value $.01 Per Share | 7,173,272 Shares |
DOCUMENTS INCORPORATED BY REFERENCE
Portions of the definitive Proxy Statement for the 2014 Annual Meeting of Stockholders are hereby incorporated by reference into Part III of Form 10-K.
Table of Contents
BARRETT BUSINESS SERVICES, INC.
2013 ANNUAL REPORT ON FORM 10-K
- 1 -
Table of Contents
PART I
| Item 1. | BUSINESS |
General
Company Background. Barrett Business Services, Inc. (BBSI, the Company, our or we), is a leading provider of business management solutions for small-and mid-sized companies. The company has developed a management platform that integrates tools from the human resource outsourcing industry and a knowledge-based approach from the management consulting industry. This platform, through the effective leveraging of human capital, assists our business owner clients in more effectively running their business. We believe this platform, delivered through local teams of professionals, differentiates BBSI from our competitors. BBSI was incorporated in Maryland in 1965.
Business Strategy. Our strategy is to align with the mission of small-and mid-sized business owners, driving value to their business. To do so, BBSI:
| | aligns with the business owner to frame a three-tiered management platform that brings predictability to their organization; |
| | partners with business owners to leverage their investment in human capital through a high-touch, results-oriented approach; and |
| | enables business owners to focus on their core business by reducing organizational complexity and maximizing productivity. |
Business Organization. We operate a decentralized delivery model using locally based teams, typically located within 50 miles of our client companies. We recruit senior level managers to oversee, develop and expand our business at the branch-office level. Additionally, we recruit professionals with expertise in human resources, risk management and workplace safety and various types of administration, including payroll, to field our client delivery teams. This structure fosters autonomous decision-making, allowing local teams of professionals to deliver plans that most closely align with the needs of each business owner client. It also assists us by incubating talent to support increased growth and capacity. We have clients with employees located in 22 states and the District of Columbia, through a network of 52 branch locations in California, Oregon, Washington, Idaho, Arizona, Nevada, Utah, Colorado, Maryland, Delaware and North Carolina. We also have several smaller recruiting locations in our general market areas, which are under the direction of a branch office.
BBSI believes that making significant investments in the best talent available allows us to leverage the value of this investment many times over. We motivate our management employees through a compensation package that includes a competitive base salary and the opportunity for profit sharing. At the branch level, profit sharing is in direct correlation to client performance, reinforcing a culture focused on achievement of client goals.
Services Overview. BBSIs core purpose is to advocate for business owners, particularly in the small-and mid-sized business segment. Our evolution from an entrepreneurially run company to a professionally managed organization has helped to form
- 2 -
Table of Contents
our view that all businesses experience inflection points at key stages of growth. The insights gained through our own growth, along with the trends we see in working with more than 3,000 companies each day, define our approach to guiding business owners through the challenges associated with being an employer.
BBSIs business teams align with each business owner client through a structured three-tiered progression. In doing so, business teams focus on the objectives of each business owner and deliver planning, guidance and resources in support of those objectives.
Tier 1: Tactical Alignment
The first stage focuses on the mutual setting of expectations and is essential to a successful client relationship. It begins with a process of assessment and alignment in which the business owners attitudes, objectives and culture are aligned with BBSIs processes, controls and culture. This stage includes an implementation process, which addresses the administrative components of managing employees.
Tier 2: Dynamic Relationship
The second stage of the relationship focuses on the development of the clients organization. There is a focus on process improvement, development of best practices, supervisor development and leadership training.
Tier 3: Strategic Counsel
With a focus on advocating for the business owner, activities in the third stage of the relationship are more strategic and forward-looking with a goal of cultivating an environment in which all efforts are directed by the mission and objectives of the business owner.
In addition to serving as resource and guide, BBSI has the ability to provide workers compensation coverage as a means of meeting statutory requirements and protecting our clients from employment-related injury claims. Through our internal claims managers and our third-party administrators, we provide claims management services for our co-employed clients. We work aggressively to manage and reduce job injury claims, identify fraudulent claims and structure optimal work programs, including modified duty employees.
Categories of Services
We report financial results in two categories of services: Professional Employer Services (PEO) and Staffing. During 2013, we served approximately 3,200 PEO clients, which compares to approximately 2,910 PEO clients during 2012. At December 31, 2013, we had approximately 2,850 PEO clients and employed approximately 70,250 employees pursuant to PEO contracts, as compared to approximately 2,550 PEO clients and approximately 56,210 employees as of December 31, 2012. During 2013, we provided staffing services to approximately 1,870 staffing services customers, which compares to approximately 1,850 customers during 2012. See the table on page 29 of this report for the percentages of total net revenues from our staffing and PEO services for the three years in the period ended December 31, 2013.
PEO. We enter into a client services agreement to become a co-employer of the clients existing workforce, assuming responsibility for payroll, payroll taxes, workers
- 3 -
Table of Contents
compensation coverage and certain other administrative functions, while the business owner client maintains physical care, custody and control of their workforce, including the authority to hire and terminate employees.
Staffing and Recruiting. Our staffing services include on-demand or short-term staffing assignments, contract staffing, long-term or indefinite-term on-site management, and direct placement. Our recruiting experts maintain a deep network of professionals from which we source candidates. Through an assessment process, we gain an understanding of the short-and long-term needs of our clients, allowing us to identify and source the right talent for each position. We then conduct a rigorous screening process to help ensure a successful hire.
Clients and Client Contracts
Our business is typically characterized by long-term relationships that result in recurring revenue. Our client relationships are codified in a Client Services Agreement, which typically provides for an initial term of one year with renewal for additional one-year periods but generally permit cancellation by either party upon 30 days written notice. In addition, we may terminate the agreement at any time for specified reasons, including nonpayment or failure to follow our workplace safety program. Our annual client retention rate is in excess of 90%. We do not include clients we have terminated in our retention calculation.
The client services agreement also provides for indemnification of us by the client against losses arising out of any default by the client under the agreement, including failure to comply with any employment-related, health and safety, or immigration laws or regulations. Our client service agreement requires clients in a co-employment arrangement to maintain comprehensive liability coverage in the amount of $1.0 million for acts of their employees. Although no claims exceeding such policy limits have been paid by us to date, the possibility exists that claims for amounts in excess of sums available to us through indemnification or insurance may be asserted in the future, which could adversely affect profitability.
We have client services agreements with a diverse array of customers, including among others, electronics manufacturers, various light-manufacturing industries, agriculture-based companies, transportation and shipping enterprises, food processing, telecommunications, public utilities, general contractors in various construction-related fields and professional services firms. None of our clients individually represented more than 1% of our total revenues in 2013.
Market Opportunity
As a company that aligns with the mission of business owners by providing resources and guidance to small and mid-size business, BBSI believes its growth is driven by the desire of business owners to focus on mission-critical functions, reduce complexity associated with the employment function, mitigate costs and maximize the investment in human capital. Our integrated management platform has enabled us to capitalize on these needs within the small to mid-size business sector.
The small and mid-sized business segment is particularly attractive because:
| | it is large, continues to grow and remains under served by professional services companies; |
- 4 -
Table of Contents
| | it typically has fewer in-house resources than larger businesses and, as a result, is generally more dependent on external resources; |
| | we generally experience a relatively high client retention rate and lower client acquisition costs within this market segment; and |
| | in addition, we have found that small to mid-size businesses are responsive to quality of service, ease-of-use, and responsiveness to clients needs when selecting a PEO or staffing services provider. |
Competition
The business environment in which we operate is characterized by intense competition and fragmentation. BBSI is not aware of reliable statistics regarding the number of its competitors, but certain large, well-known companies typically compete with us in the same markets and also have greater financial and marketing resources than we do, including Automatic Data Processing, Inc., Manpower, Inc., Kelly Services, Inc., Insperity, Inc., TriNet, and Paychex, Inc. We may face additional competition in the future from new entrants to the field, including other staffing services companies, payroll processing companies and insurance companies. The principal competitive factors in the business environment in which we operate are price and level of service.
We believe that our growth is attributable to our ability to provide small and mid-sized companies with the resources and knowledge base of a large employer delivered through a local operations team. Our level of integration with each client business provides us an additional competitive advantage.
Sales and Marketing
Sales and marketing efforts are led by our area managers and a team of business development professionals. BBSIs business development is the primary function of our area managers, and is focused on branch-level development of local business relationships. We believe our clients are our best advocates and powerful drivers of our brand awareness. We support our clients and foster advocacy through branch-based business teams. Each integrated team is comprised of a client-facing Business Partner, HR Consultant, Risk Management Consultant, a Payroll Specialist and in some instances, a recruiting specialist. By developing business teams in our existing branches, we expect to see incremental growth in the markets where we currently do business, driven by our reputation and client referrals.
On a regional and national level, we seek to expand and align our services to meet business demand, which may include opening additional offices to better support a clients geographic needs, or adding new business teams within an existing branch location. We believe our business teams serve a dual purpose: 1) Delivering high-quality guidance to our clients, thereby supporting client business growth and driving client referrals, and 2) Incubating talent at the branch level to support expansion into new markets.
Our business growth has three sources: referrals from existing clients, direct business-to-business sales efforts by our area managers, and an extensive referral network. Our referral partners include insurance brokers, financial advisors, attorneys, CPAs, and other business
- 5 -
Table of Contents
professionals who can facilitate an introduction to prospective clients. These partners, typically in exchange for a fee equal to a small percentage of payroll, facilitate introductions to business owners on our behalf.
Growth Strategy
Our growth strategy is focused in the following areas:
| | Support, strengthen and expand branch office operations through the ongoing development of business units. We believe that strengthening and expanding the operations of each location is an efficient and effective means of increasing market share in the geographic areas in which we do business. Because we understand that successful and satisfied client companies are a powerful driver of brand awareness, we focus on creating and expanding business units within each branch that provide tactical and strategic guidance to our client base. As our presence in each market grows through the addition of branch business units, we believe market awareness of our reputation and services increases. |
| | Enhance management information systems. We continue to invest in developing our information technology infrastructure. We believe that our platform gives us a competitive advantage by allowing us to provide a high level of flexibility to satisfy a variety of demands of our small and medium-sized business clients on a cost-effective basis. Furthermore, we believe that our current technology platform is capable of supporting our planned development of new business units for the foreseeable future. |
| | Penetrate new markets. We intend to open additional branch offices in new geographic markets as opportunities arise. We have developed a well-defined approach to geographic expansion, which will serve as a guide for entering new markets. We believe our decentralized organizational model built on teams of senior-level professionals allows us to incubate talent as we expand into new markets. |
Workers Compensation
Through our client services agreement, we have the ability to provide workers compensation coverage to our clients. We provide this coverage through a variety of methods, all of which are subject to rigorous underwriting to assess financial stability, risk factors and cultural alignment related to safety and the clients desire to improve their operations. In providing this coverage, we are responsible for complying with applicable statutory requirements for workers compensation coverage. Additionally, risk mitigation is an important contributor to our principal goal of helping business owners operate their business more efficiently. It is in the mutual interests of the client and BBSI to commit to workplace safety and risk mitigation.
Elements of Workers Compensation System. State law (and for certain types of employees, federal law) generally mandates that an employer reimburse its employees for the costs of medical care and other specified benefits for injuries or illnesses, including catastrophic injuries and fatalities, incurred in the course and scope of employment. The benefits payable for
- 6 -
Table of Contents
various categories of claims are determined by state regulation and vary with the severity and nature of the injury or illness and other specified factors. In return for this guaranteed protection, workers compensation is an exclusive remedy and employees are generally precluded from seeking other damages from their employer for workplace injuries. Most states require employers to maintain workers compensation insurance or otherwise demonstrate financial responsibility to meet workers compensation obligations to employees. In many states, employers who meet certain financial and other requirements are permitted to self-insure. See Regulatory and Legislative Issues below for a discussion of recent developments in California.
Self Insurance for Workers Compensation. In August 1987, we became a self-insured employer for workers compensation coverage in Oregon. We subsequently obtained self-insured employer status for workers compensation in California, Delaware, Maryland and Colorado, as well as in Washington for our staffing and management employees. Regulations governing self-insured employers in each jurisdiction typically require the employer to maintain surety bonds, surety deposits of government securities, letters of credit or other financial instruments to cover workers claims in the event the employer is unable to pay for such claims.
To manage our financial exposure to catastrophic injuries and fatalities, we maintain excess workers compensation insurance coverage. Our wholly owned, fully licensed captive insurance company incorporated in Arizona, Associated Insurance Company for Excess (AICE), provides us with excess workers compensation coverage from $1.0 million up to $5.0 million per occurrence in the states of Oregon, California, Delaware and Washington. Additional excess workers compensation insurance coverage is provided through annual policies issued by ACE Group (ACE) from $5.0 million to $15.0 million per occurrence, except for our Maryland and Colorado operations.
Our excess insurance policy in Maryland has a $1.0 million retention with a $25.0 million limit and our excess insurance policy in Colorado has a $2.0 million retention and statutory limits on a per occurrence basis. This approach results in an effective per occurrence retention, on a consolidated basis, of $5.0 million. This higher per occurrence retention may result in higher workers compensation costs to us with a corresponding negative effect on our operating results. AICE provides us with access to an alternative mechanism for excess insurance coverage, as well as certain income tax benefits arising from the ability to accelerate the deduction, for tax purposes, of certain accruals for workers compensation claims.
Additionally, we formed Ecole Insurance Company, a wholly owned fully licensed insurance company in Arizona (Ecole), to provide workers compensation coverage to our employees working in Arizona, beginning with claims occurring on or after March 1, 2010. Additional reinsurance coverage for Ecole is provided by ACE from $5.0 million to statutory limits per occurrence.
Claims Management. As a self-insured employer, our workers compensation expense is tied directly to the incidence and severity of workplace injuries to our employees. We seek to contain our workers compensation costs through an aggressive approach to claims management. We use managed-care systems to reduce medical costs and keep time-loss costs to a minimum by assigning injured workers, whenever possible, to short-term assignments which accommodate the workers physical limitations. We believe that these assignments minimize both time actually lost from work and covered time-loss costs. We
- 7 -
Table of Contents
employ internal, professionally licensed claims adjusters and engage third-party claims administrators (TPAs) to provide the principal claims management expertise. Typical management procedures include performing thorough and prompt on-site investigations of claims filed by employees, working with physicians to encourage efficient medical management of cases, denying questionable claims and attempting to negotiate early settlements to eliminate future development of claims costs. We also maintain a corporate-wide pre-employment drug screening program and a mandatory post-injury drug test. The program is believed to have resulted in a reduction in the frequency of fraudulent claims and in accidents in which the use of illegal drugs appears to have been a contributing factor.
Elements of Self-Insurance Costs. The costs associated with our self-insured workers compensation program include case reserves for reported claims, an additional expense provision for potential future increases in the cost of open injury claims (known as adverse loss development) and claims incurred in prior periods but not reported (referred to as IBNR), fees payable to our TPAs, additional claims administration expenses, administrative fees payable to state workers compensation regulatory agencies, legal fees, fees paid for business referrals, premiums for excess workers compensation insurance, and costs associated with forming and operating our wholly owned, fully licensed captive insurance company for excess coverage. The state assessments are typically based on payroll amounts and, to a limited extent, the amount of permanent disability awards during the previous year. Excess insurance premiums are also based in part on the size and risk profile of our payroll and loss experience.
Recent Developments in California. In September 2012, California Senate Bill 863 (SB 863), was signed into law. Under SB 863, the California Director of Self-Insurance was required not to issue certificates of consent to self-insure after January 1, 2013, to any employer engaged in the activities of a professional employer organization, a leasing employer, a temporary services employer or any employer the Director determines to be in the business of providing employees to other employers. Additionally, the Director is required to revoke any previously issued certificate of consent to self-insure in favor of any employer engaged in these types of activities not later than January 1, 2015. To address this issue, BBSI has entered into an arrangement typically known as a fronted program with ACE Group. Under this arrangement, the risk of loss up to the first $5.0 million per claim will be retained by BBSI through an indemnity agreement, although ACE will be responsible for any claims BBSI is unable to satisfy. In addition, ACE continues to be BBSIs carrier for costs in excess of $5.0 million per claim. During 2014, we will transition to the ACE program so that by December 31, 2014, all of our employees working in California will be covered by this new arrangement. We expect to incur increased costs during this transition that will likely continue following implementation of the fronted insurance program.
Workers Compensation Claims Experience and Reserves
We recognize our liability for the ultimate payment of incurred claims and claims adjustment expenses by accruing liabilities which represent estimates of future amounts necessary to pay claims and related expenses with respect to covered events that have occurred. When a claim involving a probable loss is reported, our internal claims management personnel or our TPA establishes a case reserve for the estimated amount of ultimate loss. The estimate reflects an informed judgment based on established case reserving practices and the experience and knowledge of our claims management staff and the TPA regarding
- 8 -
Table of Contents
the nature and expected amount of the claim, as well as the estimated expenses of settling the claim, including legal and other fees and expenses of claims administration. The adequacy of such case reserves in part depends on the professional judgment of both our claims management staff and our TPA to properly and comprehensively evaluate the economic consequences of each claim. Our reserves include an additional component for both estimated future adverse loss development in excess of initial case reserves on open claims and for incurred but not reported claims (together IBNR) based upon actuarial estimates provided by the Companys independent actuary. Our reserves do not include an estimated provision for the incidence of unknown or unreported catastrophic claims.
As part of the case reserving process, historical data is reviewed and consideration is given to the anticipated effect of various factors, including known and anticipated legal developments, inflation and economic conditions. Reserve amounts are based on managements estimates, and as other data becomes available, these estimates are revised, which may result in increases or decreases in existing case reserves. Managements internal accrual process for workers compensation expense is based upon the immediate recognition of an expense and the related liability at the time a claim occurs; the value ascribed to the expense and liability is based upon our internal claims management and the TPAs estimate of ultimate claim cost coupled with a provision for estimated future development based upon an actuarial review performed quarterly by our independent actuary. We believe our total accrued workers compensation claims liabilities at December 31, 2013 are adequate. It is possible, however, that our actual future workers compensation obligations may exceed the amount of our accrued liabilities, with a corresponding negative effect on future earnings, due to such factors as unanticipated adverse loss development of known claims and, to a much lesser extent, of claims incurred but not reported.
Failure to successfully manage the severity and frequency of workplace injuries would result in increased workers compensation expense and would have a negative effect, which may be substantial, on our operating results and financial condition. BBSI maintains clear guidelines for our area managers and risk management consultants, directly tying their continued employment to their diligence in understanding and addressing the risks of accident or injury associated with the industries in which client companies operate and in monitoring clients compliance with workplace safety requirements. We have a policy of zero tolerance for avoidable workplace injuries. Each of our risk management consultants has the authority to cancel any client at any time based upon their assessment of their safe-work practices or philosophies.
Employees and Employee Benefits
At December 31, 2013, we had approximately 79,315 total employees, including approximately 8,600 staffing services employees, approximately 70,250 employees under our client service agreements, 465 managerial, sales and administrative employees and three executive officers. The number of employees at any given time may vary significantly due to business conditions at customer or client companies. Substantially all of our managerial, sales and administrative employees have entered into a standard form of employment agreement which, among other provisions, contains covenants not to engage in certain activities in competition with us for 18 months following termination of employment and to maintain the confidentiality of certain proprietary information. We believe our employee relations are good.
- 9 -
Table of Contents
We offer various qualified employee benefit plans to our employees, including those employees for whom we are the administrative employer in a co-employment agreement who so elect. These qualified employee benefit plans include our 401(k) plan to which employees may begin making contributions upon reaching 21 years of age and completing 1,000 hours of service in any consecutive 12-month period. We may also make contributions to the 401(k) plan, which vest over six years and are subject to certain legal limits, at the sole discretion of our Board of Directors. We make matching contributions to the 401(k) plan under a safe harbor provision, whereby we match 100% of contributions by management and staffing employees to the 401(k) plan up to 3% of each participating employees annual compensation and 50% of the employees contributions up to an additional 2% of annual compensation. We also offer a cafeteria plan under Section 125 of the Internal Revenue Code; and group health, life insurance and disability insurance plans. Generally, qualified employee benefit plans are subject to provisions of both the Internal Revenue Code and the Employee Retirement Income Security Act of 1974 (ERISA). In order to qualify for favorable tax treatment under the Internal Revenue Code, qualified plans must be established and maintained by an employer for the exclusive benefit of its employees.
Regulatory and Legislative Issues
Business Operations. We are subject to the laws and regulations of the jurisdictions within which we operate, including those governing self-insured employers under the workers compensation systems in Oregon, California, Maryland, Delaware and Colorado, as well as in Washington for staffing and management employees. As a result of legislation in California related to our self-insurance program, we will be transitioning out of self-insurance in California during 2014 into an insured program with ACE Group. See Workers Compensation-Recent Legislative Developments in California above. We are also subject to laws and regulations governing our two wholly owned, fully licensed insurance companies in Arizona. While the specific laws and regulations vary among these jurisdictions, they typically require some form of licensing and often have statutory requirements for workplace safety and notice of change in obligation of workers compensation coverage in the event of contract termination. Although compliance with these requirements imposes some additional financial risk on us, particularly with respect to those clients who breach their payment obligation to us, such compliance has not had a material adverse effect on our business to date.
Employee Benefit Plans. Our operations are affected by numerous federal and state laws relating to labor, tax and employment matters. Through our client services agreement, we assume certain obligations and responsibilities as the administrative employer under federal and state laws. Because many of these federal and state laws were enacted prior to the development of nontraditional employment relationships, such as professional employer, temporary employment, and outsourcing arrangements, many of these laws do not specifically address the obligations and responsibilities of nontraditional employers. In addition, the definition of employer under these laws is not uniform.
As an employer, we are subject to all federal statutes and regulations governing our employer-employee relationships. Subject to the discussion of risk factors below, we believe that our operations are in compliance in all material respects with applicable federal statutes and regulations.
- 10 -
Table of Contents
Additional Information
Our filings with the SEC, including our annual report on Form 10-K, quarterly reports on Form 10-Q, periodic reports on Form 8-K and amendments to these reports, are accessible free of charge at our website at http://www.barrettbusiness.com as soon as reasonably practicable after filing with the SEC. By making this reference to our website, we do not intend to incorporate into this report any information contained in the website. The website should not be considered part of this report.
The SEC maintains a website at http://www.sec.gov that contains reports, proxy and information statements, and other information regarding issuers with publicly traded securities, including the Company.
| Item 1A. | RISK FACTORS |
In addition to other information contained in this report, the following risk factors should be considered carefully in evaluating our business.
Our workers compensation loss reserves may be inadequate to cover our ultimate liability for workers compensation costs.
We maintain reserves (recorded as accrued liabilities on our balance sheet) to cover our estimated liabilities for our self-insured workers compensation claims. The determination of these reserves is based upon a number of factors, including current and historical claims activity, claims payment patterns and medical cost trends and developments in existing claims. Accordingly, reserves do not represent an exact calculation of liability. Reserves can be affected by both internal and external events, such as adverse developments on existing claims or changes in medical costs, medical condition of the claimant, claims handling procedures, administrative costs and legal fees, inflation, and legal trends and legislative changes. Reserves are adjusted from time to time to reflect new claims, claim developments, or systemic changes, and such adjustments are reflected in the results of the periods in which the reserves are changed. The Companys estimated accrual for workers compensation claims liabilities is based upon an actuarial estimate provided by the Companys independent actuary. The estimated accrual does not include an estimated provision for the incidence of unknown catastrophic claims. Moreover, because of the uncertainties that surround estimating workers compensation loss reserves, we cannot be certain that our reserves are adequate. If our reserves are insufficient to cover our actual losses, we would have to increase our reserves and incur charges to our earnings that could be material to our results of operations and financial condition.
Our self-insured retention for workers compensation claims is $5.0 million per occurrence in the majority of our self-insured states.
In view of the Companys favorable historical experience with large catastrophic claims and an opportunity to realize savings from lower excess workers compensation insurance premiums, we maintain our self-insured retention at $5.0 million per occurrence, except in Colorado and Maryland where our retention is at $2.0 million and $1.0 million per occurrence, respectively. Additionally, Ecoles retention is at $5.0 million per occurrence for coverage in Arizona. Thus, the Company has financial risk for most workers compensation
- 11 -
Table of Contents
claims under $5.0 million, on a per occurrence basis. This level of per occurrence retention may result in higher workers compensation costs to us with a corresponding negative effect on our operating results and financial condition.
Adverse developments in the market for excess workers compensation insurance could lead to increases in our costs.
We are a state-approved self-insured employer for workers compensation coverage in California, Oregon, Delaware, Maryland and Colorado, as well as in Washington for our staffing and management employees. To manage our financial exposure in the event of catastrophic injuries or fatalities, we maintain excess workers compensation insurance with a per occurrence retention of $5.0 million effective January 1, 2007, except in Colorado and Maryland where our retention is at $2.0 million and $1.0 million per occurrence, respectively. Additionally, Ecoles retention is at $5.0 million per occurrence for coverage in Arizona. Changes in the market for excess workers compensation insurance may lead to limited availability of such coverage, additional increases in our insurance costs or further increases in our self-insured retention, any of which may have a material adverse effect on our financial condition.
Economic conditions, particularly in California, may impact our ability to attract new clients and cause our existing clients to reduce staffing levels or cease operations.
Weak economic conditions typically have a negative impact on small-and mid-sized businesses, which make up the majority of our clients. In turn, these businesses could cut costs, including trimming employees from their payrolls, or ceasing operations altogether. In addition, businesses may be reluctant to enter into new client service agreements because of the uncertainty regarding the timing of any economic recovery. These forces may result in decreased revenues due both to the downsizing of our current clients and difficulties in attracting new clients, and may also result in additional bad debt expense to the extent that existing clients cease operations.
If we are unable to maintain our brand image and corporate reputation, our business may suffer.
Our success depends in part on our ability to maintain our reputation for providing excellent service to our customers. Service quality issues, actual or perceived, even when false or unfounded, could tarnish the image of our brand and may cause customers to use other companies. Also, adverse publicity surrounding labor relations, security matters, and the like, or attempts to connect our Company to these sorts of issues could negatively affect our overall reputation. Damage to our reputation could reduce demand for our services and thus have an adverse effect on our business, financial position and results of operations.
Our staffing business is vulnerable to economic fluctuations.
Demand for our staffing services is sensitive to changes in the level of economic activity in the regions in which we do business. As economic activity slows down, companies often reduce their use of temporary employees before undertaking layoffs of permanent staff, resulting in decreased demand for staffing services. During strong economic periods, on the other hand, we often experience shortages of qualified employees to meet customer needs.
- 12 -
Table of Contents
Changes in the market for workers compensation insurance in the state of California could adversely affect our business.
Our concentration of business in California subjects our business to market risks involving the California workers compensation environment. During recent years, California has enacted several legislative reforms in an attempt to address concerns relating to its workers compensation system, including recent legislation that will cause us to end our self-insurance program for workers compensation in California. The California legislature or regulatory bodies in the state may attempt additional legislative or regulatory reforms in the future. Implementation of our proposed fronted insurance program in response to recent legislation is expected to result in increased costs and may remove a competitive advantage we had in California, our largest market. See Business Workers Compensation Recent Developments in California above. Any additional successful legislative reforms or non-governmental changes in market conditions in California could further lessen an important advantage we have in that state, leading to a reduction in our new business opportunities and a potential slowing in the growth of our business in California. Any such slowing would adversely affect our results of operations.
Because we assume the obligation to make wage, tax and regulatory payments in respect of some employees, we are exposed to client credit risks.
We generally assume responsibility for and manage the risks associated with our clients employee payroll obligations, including liability for payment of salaries and wages (including payroll taxes), as well as group health and retirement benefits. These obligations are fixed, whether or not the client makes payments to us as required by our services agreement, which exposes us to credit risks. We attempt to mitigate this risk by invoicing our clients at the end of their specific payroll processing cycle. We also carefully monitor the timeliness of our clients payments and impose strict credit standards on our customers. If we fail to successfully manage our credit risk, our results of operations and financial condition could be materially and adversely affected.
Increases in unemployment claims could raise our state and federal unemployment tax rates which we may not be able to pass on to our customers.
During weak economic conditions in our markets, the level of unemployment claims tend to rise as a result of employee layoffs at our clients and lack of work in our temporary staffing pool. The rise in unemployment claims often results in higher state and federal unemployment tax rates which in most instances cannot be concurrently passed on to our customers either due to existing client services agreements or competitive pricing pressures. Increases in our state and federal unemployment tax rates could have a material adverse effect on our results of operations, particularly in the early part of the calendar year when effective payroll tax rates are at or near their maximum.
If we are determined not to be an employer under certain laws and regulations, our clients may stop using our services, and we may be subject to additional liabilities.
We are the administrative employer in our co-employment relationships under the various laws and regulations of the Internal Revenue Service and the U.S. Department of Labor. If we are determined not to be the administrative employer under such laws and
- 13 -
Table of Contents
regulations and are therefore unable to assume our clients obligations for employment and other taxes, our clients may be held jointly and severally liable for payment of such taxes. Some clients or prospective clients may view such potential liability as an unacceptable risk, discouraging current clients from continuing a relationship with us or prospective clients from entering into a new relationship with us. Any determination that we are not the administrative employer for purposes of ERISA could adversely affect our cafeteria benefits plan operated under Section 125 of the Internal Revenue Code and result in liabilities to us under the plan.
We may be exposed to employment-related claims and costs and periodic litigation that could adversely affect our business and results of operations.
We either co-employ employees in connection with our client services agreements or place our employees in our customers workplace in connection with our staffing business. As such, we are subject to a number of risks inherent to our status as the administrative employer, including without limitation:
| | claims of misconduct or negligence on the part of our employees, discrimination or harassment claims against our employees, or claims by our employees of discrimination or harassment by our clients; |
| | immigration-related claims; |
| | claims relating to violations of wage, hour and other workplace regulations; |
| | claims relating to employee benefits, entitlements to employee benefits, or errors in the calculation or administration of such benefits; and |
| | possible claims relating to misuse of customer confidential information, misappropriation of assets or other similar claims. |
If we experience significant incidents involving any of the above-described risk areas we could face substantial out-of-pocket losses, fines or negative publicity. In addition, such claims may give rise to litigation, which may be time consuming, distracting and costly, and could have a material adverse effect on our business. With respect to claims involving our co-employer relationships, although our client services agreement provides that the client will indemnify us for any liability attributable to the conduct of the client or its employees, we may not be able to enforce such contractual indemnification, or the client may not have sufficient assets to satisfy its obligations to us.
If our efforts to protect the security of personal information about our employees and clients are unsuccessful, we could be subject to costly government enforcement actions and private litigation and our reputation could suffer.
The nature of our business involves the receipt, storage, and transmission of personal and proprietary information about thousands of employees and some clients. If we experience a significant data security breach or fail to detect and appropriately respond to a significant data security breach, we could be exposed to government enforcement actions and private litigation. In addition, our employees and clients could lose confidence in our
- 14 -
Table of Contents
ability to protect their personal and proprietary information, which could cause them to terminate their relationships with us. Any loss of confidence arising from a significant data security breach could hurt our reputation, further damaging our business.
We operate in a complex regulatory environment, and failure to comply with applicable laws and regulations could adversely affect our business.
Corporate human resource operations are subject to a broad range of complex and evolving laws and regulations, including those applicable to payroll practices, benefits administration, employment practices and privacy. Because our clients have employees in many states throughout the United States, we must perform our services in compliance with the legal and regulatory requirements of multiple jurisdictions. Some of these laws and regulations may be difficult to ascertain or interpret and may change from time to time. Violation of such laws and regulations could subject us to fines and penalties, damage our reputation, constitute a breach of our client agreements, impair our ability to obtain and renew required licenses, and decrease our profitability or competitiveness. If any of these effects were to occur, our operating results and financial condition could be adversely affected.
Changes in government regulations may result in restrictions or prohibitions applicable to the provision of employment services or the imposition of additional licensing, regulatory or tax requirements.
Our business is heavily regulated in most jurisdictions in which we operate. We cannot assure you that the states in which we conduct or seek to conduct business will not:
| | impose additional regulations that prohibit or restrict employment-related businesses like ours; |
| | require additional licensing or add restrictions on existing licenses to provide employment-related services; or |
| | increase taxes or make changes in the way in which taxes are calculated for providers of employment-related services. |
Any changes in applicable laws and regulations may make it more difficult or expensive for us to do business, inhibit expansion of our business, or result in additional expenses that limit our profitability or decrease our ability to attract and retain clients.
The tax status of our insurance subsidiaries could be challenged resulting in an acceleration of income tax payments.
In conjunction with our workers compensation program, we operate two wholly owned insurance subsidiaries, AICE and Ecole. We recognize the two subsidiaries as insurance companies for federal income tax purposes, with respect to our consolidated federal income tax return. In the event the Internal Revenue Service (IRS) were to determine that the subsidiaries do not qualify as insurance companies, we could be required to make accelerated income tax payments to the IRS that we otherwise would have deferred until future periods.
- 15 -
Table of Contents
We may find it difficult to expand our business into additional states due to varying state regulatory requirements.
Future growth in our operations depends, in part, on our ability to offer our services to prospective clients in new states, which may subject us to different regulatory requirements and standards. In order to operate effectively in a new state, we must obtain all necessary regulatory approvals, adapt our procedures to that states regulatory requirements and modify our service offerings to adapt to local market conditions. In the event that we expand into additional states, we may not be able to duplicate in other markets the financial performance experienced in our current markets.
Acquisitions subject us to various risks, including risks relating to selection and pricing of acquisition targets, integration of acquired companies into our business and assumption of unanticipated liabilities.
We have completed 27 acquisitions since 1993 and may pursue additional acquisitions and investment opportunities. We cannot assure, however, that we will be able to identify or complete additional acquisitions. If we do pursue acquisitions, we may not realize the anticipated benefits of such acquisitions. Acquisitions involve many risks, including risks relating to the assumption of unforeseen liabilities of an acquired business, adverse accounting charges resulting from the acquisition, and difficulties in integrating acquired companies into our business, both from a cultural perspective, as well as with respect to personnel and client retention and technological integration. Acquired liabilities may be significant and may adversely affect our financial condition and results of operations. Our inability to successfully integrate acquired businesses may lead to increased costs, failure to generate expected returns, accounting charges, or even a total loss of amounts invested, any of which could have a material adverse effect on our financial condition and results of operations.
Our business is subject to risks associated with geographic market concentration.
Our California and Oregon operations accounted for approximately 74% and 8%, respectively, of our total net revenues in 2013. As a result of the current importance of our California and Oregon operations and anticipated continued growth from these operations, our profitability over the next several years is expected to be largely dependent on economic and regulatory conditions in these markets, particularly in California. If these states experience economic downturn, or if the regulatory environment changes in a way that adversely affects our ability to do business in these states or limits our competitive advantages in these markets, our profitability and growth prospects may be materially and adversely affected.
We face competition from a number of other companies.
We face competition from various companies that may provide all or some of the services we offer. Our competitors include companies that are engaged in staffing services such as Kelly Services, Inc. and Manpower Inc., companies that are focused on co-employment, such as Insperity, Inc. and companies that primarily provide payroll processing services, such as Automatic Data Processing, Inc. and Paychex, Inc. We also face competition from information technology outsourcing firms and broad-based outsourcing and consulting firms that perform individual projects.
- 16 -
Table of Contents
Several of our existing or potential competitors have substantially greater financial, technical and marketing resources than we do, which may enable them to:
| | develop and expand their infrastructure and service offerings more quickly and achieve greater cost efficiencies; |
| | invest in new technologies; |
| | expand operations into new markets more rapidly; |
| | devote greater resources to marketing; |
| | compete for acquisitions more effectively and complete acquisitions more easily; and |
| | aggressively price products and services and increase benefits in ways that we may not be able to match financially. |
In order to compete effectively in our markets, we must target our potential clients carefully, continue to improve our efficiencies and the scope and quality of our services, and rely on our service quality, innovation, education and program clarity. If our competitive advantages are not compelling or sustainable, then we are unlikely to increase or sustain profits and our stock price could decline.
We are dependent upon certain key personnel and recruitment and retention of key employees may be difficult and expensive.
We believe that the successful operation of our business is dependent upon our retention of the services of key personnel, including our Chief Executive Officer, other executive officers and area managers. We may not be able to retain all of our executives, senior managers and key personnel in light of competition for their services. If we lose the services of one of our executive officers or a significant number of our senior managers, our operations and profitability likely would be adversely affected.
We do not have an expansive in-house sales staff and therefore rely extensively on referral partners.
We maintain a minimal internal professional sales force and we rely heavily on referral partners to provide referrals to new business, especially in California, although each area manager is expected to be an effective leader in business development, including marketing efforts and sales closures. In connection with these arrangements, we pay a fee to referral partners for new clients. As a result, we are dependent on firms and individuals that do not have an exclusive relationship with us. If we are unable to maintain these relationships, if they increase their fees or lose confidence in our services, we could face declines in our business and additional costs and uncertainties as we attempt to hire and train an internal sales force.
We depend on attracting and retaining qualified employees; during periods of economic growth, our costs to do so increase and it becomes more difficult to attract and retain people.
The success of our staffing services depends on our ability to attract and retain qualified employees for placement with our customers. Our ability to attract and retain
- 17 -
Table of Contents
qualified personnel could be impaired by rapid improvement in economic conditions resulting in lower unemployment and increases in compensation. During periods of economic growth, we face growing competition for retaining and recruiting qualified personnel, which in turn leads to greater advertising and recruiting costs and increased salary expenses. If we cannot attract and retain qualified employees, the quality of our services may deteriorate and our reputation and results of operations could be adversely affected.
Our service agreements may be terminated on short notice, leaving us vulnerable to loss of a significant amount of customers in a short period of time, if business or regulatory conditions change or events occur that negatively affect our reputation.
Our client services agreements are generally terminable on 30 days notice by either us or the client. As a result, our clients may terminate their agreement with us at any time, making us particularly vulnerable to changing business or regulatory conditions or changes affecting our reputation or the reputation of our industry.
Our industry has at times received negative publicity that, if it were to become more prevalent, could cause our business to decline.
In the industries in which we compete, companies periodically have been tarnished by negative publicity or scandals from poor business judgment or even outright fraud. If we or our industry face negative publicity, customers confidence in the use of temporary personnel or co-employed workers may deteriorate, and they may be unwilling to enter into or continue our staffing or co-employment relationships. If a negative perception were to prevail, it would be more difficult for us to attract and retain customers.
Changes in state unemployment tax laws and regulations could adversely affect our business.
In past years, there has been significant negative publicity relating to the use of staffing or PEO companies to shield employers from poor unemployment history and high unemployment taxes. New legislation enacted at the state or federal level to try to counter this perceived problem could have a material adverse effect on our business by limiting our ability to market our services or making our services less attractive to our customers and potential customers.
We are dependent upon technology services and if we experience damage, service interruptions or failures in our computer and telecommunications systems, our client relationships and our ability to attract new clients may be adversely affected.
We rely extensively on our computer systems to manage our branch network, perform employment-related services, accounting and reporting, and summarize and analyze our financial results. Our systems are subject to damage or interruption from telecommunications failures, power-related outages, computer viruses and malicious attacks, security breaches and catastrophic events. If our systems are damaged or fail to function properly, we may incur substantial costs to repair or replace them, experience loss of critical data and interruptions or delays in our ability to manage our operations, and encounter a loss of client confidence. Because our business involves the storage of clients proprietary information and confidential personal data of employees, security breaches could expose us
- 18 -
Table of Contents
to regulatory actions, litigation, possible liability or fines, and damage to our reputation. In addition, our clients businesses may be adversely affected by any system or equipment failure or breach we experience. As a result, our relationships with our clients may be impaired, we may lose clients, our ability to attract new clients may be adversely affected and we could be exposed to contractual liability. We may invest in upgrades or replacements to our existing systems or additional security measures, each of which can involve substantial costs and risks relating to installation and implementation.
Maryland law and our Charter and bylaws contain provisions that could make the takeover of the Company more difficult.
Certain provisions of Maryland law and our Charter and bylaws could have the effect of delaying or preventing a third party from acquiring the Company, even if a change in control would be beneficial to our stockholders. These provisions of our Charter and bylaws:
| | permit the Board of Directors to issue up to 500,000 shares of preferred stock with such rights and preferences, including voting rights, as the Board may establish, without further approval by the Companys stockholders, which could also adversely affect the voting power of holders of our common stock; and |
| | vest the power to adopt, alter or repeal the Companys bylaws solely in the Board of Directors; the stockholders do not have that power. |
In addition, the Company is subject to the Maryland control share act (the Control Share Act). Under the Control Share Act, a person (an Acquiring Person) who acquires voting stock in a transaction (a Control Share Acquisition) which results in its holding voting power within specified ranges cannot vote the shares it acquires in the Control Share Acquisition unless voting rights are accorded to such control shares by the holders of two-thirds of the outstanding voting shares, excluding the Acquiring Person and the Companys officers and directors who are also employees of the Company.
The Company is also subject to the provisions of Maryland law limiting the ability of certain Maryland corporations to engage in specified business combinations (the Business Combination Act). Subject to certain exceptions, the Business Combination Act prohibits a Maryland corporation from engaging in a business combination with a stockholder who, with its affiliates, owns 10% or more of the corporations voting stock. These provisions will not apply to business combinations that are approved by the Board of Directors before the stockholder became an interested stockholder.
| Item 1B. | UNRESOLVED STAFF COMMENTS |
None.
- 19 -
Table of Contents
| Item 2. | PROPERTIES |
We operate through all 52 of our branch offices. The following table shows the number of locations in each state in which we operate. We also lease office space in other locations in our market areas which we use to recruit and place employees.
| Offices |
Number of Locations |
|||
| California |
19 | |||
| Oregon |
11 | |||
| Utah |
5 | |||
| Washington |
5 | |||
| Idaho |
3 | |||
| Arizona |
2 | |||
| Colorado |
2 | |||
| Maryland |
2 | |||
| Delaware |
1 | |||
| Nevada |
1 | |||
| North Carolina |
1 | |||
We lease office space for our branch offices. At December 31, 2013, our leases had expiration dates ranging from less than one year to five years, with total minimum payments through 2018 of approximately $9.1 million. Our corporate headquarters office in Vancouver, Washington occupies approximately 35 percent of the 63,500 square foot building we own.
| Item 3. | LEGAL PROCEEDINGS |
See Note 14, Litigation, in the Notes to Consolidated Financial Statements included in Item 15 of this report.
| Item 4. | MINE SAFETY DISCLOSURES |
Not Applicable
EXECUTIVE OFFICERS OF THE REGISTRANT
The following table identifies, as of March 14, 2014, each executive officer of the Company. Executive officers are elected annually and serve at the discretion of the Board of Directors.
| Name |
Age | Principal Positions and Business Experience |
Officer Since |
|||||||
| Michael L. Elich |
48 | President and Chief Executive Officer | 2005 | |||||||
| James D. Miller |
50 | Vice President-Finance, Treasurer and Secretary; Chief Financial Officer; Principal Accounting Officer | 1994 | |||||||
| Gregory R. Vaughn |
58 | Vice President and Assistant Secretary; Chief Administrative Officer |
1998 | |||||||
- 20 -
Table of Contents
Michael L. Elich joined the Company in October 2001 as Director of Business Development. He was appointed Vice President and Chief Operating Officer in May 2005. He was appointed interim President and Chief Executive Officer in January 2011 upon the death of William W. Sherertz. Effective February 17, 2011, Mr. Elich was elected to serve on the Board of Directors and was made President and Chief Executive Officer. From 1995 to 2001, Mr. Elich served as Executive Vice President and Chief Operating Officer of Skills Resource Training Center, a staffing services company with offices in Oregon, Washington and Idaho that we acquired in 2004.
James D. Miller joined the Company in January 1994 as Controller. He was promoted to Vice President-Finance, Treasurer and Secretary, and Chief Financial Officer in June 2008. From 1991 to 1994, he was the Corporate Accounting Manager for Christensen Motor Yacht Corporation. Mr. Miller, a certified public accountant on inactive status, was employed by Price Waterhouse LLP, now known as PricewaterhouseCoopers LLP, from 1987 to 1991.
Gregory R. Vaughn joined the Company in July 1997 as Operations Manager. Mr. Vaughn was appointed Vice President in January 1998 and Chief Administrative Officer in February 2012. Prior to joining Barrett, Mr. Vaughn was Chief Executive Officer of Insource America, Inc., a privately-held human resource management company headquartered in Portland, Oregon, for approximately one year. Mr. Vaughn has also held senior management positions with Sundial Time Systems, Inc., and Continental Information Systems, Inc. Previously, Mr. Vaughn was employed as a technology consultant by Price Waterhouse LLP, now known as PricewaterhouseCoopers LLP.
- 21 -
Table of Contents
PART II
| Item 5. | MARKET FOR REGISTRANTS COMMON EQUITY, RELATED STOCKHOLDER MATTERS AND ISSUER PURCHASES OF EQUITY SECURITIES |
Our common stock (the Common Stock) trades on the Global Select Market segment of The Nasdaq Stock Market under the symbol BBSI. At March 3, 2014, there were 27 stockholders of record and approximately 5,725 beneficial owners of the Common Stock.
The following table presents the high and low sales prices of the Common Stock and cash dividends paid for each quarterly period during the last two fiscal years, as reported by The Nasdaq Stock Market. Any future determination as to the payment of dividends will be made at the discretion of the Board and will depend upon the Companys operating results, financial condition, capital requirements, general business conditions and such other factors as the Board deems relevant.
| High | Low | Cash Dividends Declared |
||||||||||
| 2012 |
||||||||||||
| First Quarter |
$ | 21.10 | $ | 15.68 | $ | 0.11 | ||||||
| Second Quarter |
21.45 | 18.88 | 0.11 | |||||||||
| Third Quarter |
28.96 | 19.99 | 0.11 | |||||||||
| Fourth Quarter |
39.49 | 26.19 | 0.13 | |||||||||
| 2013 |
||||||||||||
| First Quarter |
$ | 53.27 | $ | 38.15 | $ | 0.13 | ||||||
| Second Quarter |
62.82 | 48.50 | 0.13 | |||||||||
| Third Quarter |
73.49 | 48.08 | 0.13 | |||||||||
| Fourth Quarter |
98.00 | 66.33 | 0.18 | |||||||||
The Company maintains a Board approved stock repurchase program which currently authorizes shares to be repurchased up to 3.0 million shares of the Companys stock from time to time in open market purchases. The following table summarizes information related to stock repurchases during the quarter ended December 31, 2013.
| Month |
Shares Repurchased |
Average Price Per Share |
Total Number of Shares Repurchased as Part of Publicly Announced Plan |
Maximum Number of Shares that May Yet Be Repurchased Under the Plan |
||||||||||||
| October |
0 | $ | 0 | 0 | 1,208,200 | |||||||||||
| November |
0 | 0 | 0 | 1,208,200 | ||||||||||||
| December |
0 | 0 | 0 | 1,208,200 | ||||||||||||
|
|
|
|
|
|||||||||||||
| Total |
0 | 0 | ||||||||||||||
|
|
|
|
|
|||||||||||||
The following graph shows the cumulative total return at the dates indicated for the period from December 31, 2008, until December 31, 2013, for our Common Stock, The Nasdaq Composite Index, and a group of the Companys current peers in the staffing industry (the 2013 Peer Group). The 2013 Peer Group is comprised of five companies included in the peer group used to prepare the performance graph included in the Companys Form 10-K for the year ended December 31, 2012.
- 22 -
Table of Contents
The stock performance graph has been prepared assuming that $100 was invested on December 31, 2008, in our Common Stock, The Nasdaq Composite Index, and the 2013 Peer Group, and that dividends are reinvested. In accordance with the SECs disclosure rules, the stockholder return for each company in the 2013 Peer Group indices has been weighted on the basis of market capitalization as of the beginning of each annual period shown. The stock price performance reflected in the graph may not be indicative of future price performance.
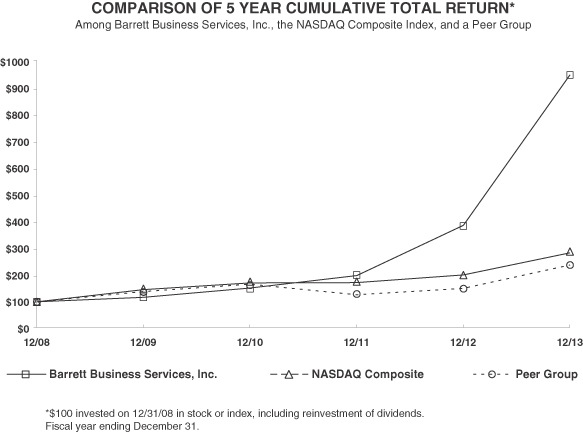
| 12/08 | 12/09 | 12/10 | 12/11 | 12/12 | 12/13 | |||||||||||||||||||
| Barrett Business Services, Inc. |
100.00 | 116.39 | 150.93 | 198.55 | 386.70 | 950.36 | ||||||||||||||||||
| NASDAQ Composite |
100.00 | 144.88 | 170.58 | 171.30 | 199.99 | 283.39 | ||||||||||||||||||
| Peer Group |
100.00 | 138.47 | 165.96 | 126.36 | 150.44 | 237.56 | ||||||||||||||||||
| Members of Peer Group |
||||||||||||||||||||||||
| CDI Corp. |
||||||||||||||||||||||||
| Insperity Inc |
||||||||||||||||||||||||
| Kelly Services Inc |
||||||||||||||||||||||||
| Manpowergroup |
||||||||||||||||||||||||
| Robert Half International Inc |
||||||||||||||||||||||||
- 23 -
Table of Contents
| Item 6. | SELECTED CONSOLIDATED FINANCIAL DATA |
The following selected consolidated financial data should be read in conjunction with the Companys financial statements and the accompanying notes listed in Item 8 of Part II, Financial Statements and Supplementary Data, and the information contained in Item 7 of Part II, Managements Discussion and Analysis of Financial Condition and Results of Operations. Historical results are not necessarily indicative of future results.
| Year Ended December 31, | ||||||||||||||||||||
| 2013 | 2012 | 2011 | 2010 | 2009 | ||||||||||||||||
| (In thousands, except per share data) |
||||||||||||||||||||
| Statement of operations: |
||||||||||||||||||||
| Revenues: |
||||||||||||||||||||
| Professional employer service fees |
$ | 388,963 | $ | 276,004 | $ | 190,113 | $ | 147,385 | $ | 120,305 | ||||||||||
| Staffing services |
143,881 | 126,648 | 124,761 | 125,738 | 116,155 | |||||||||||||||
|
|
|
|
|
|
|
|
|
|
|
|||||||||||
| Total |
532,844 | 402,652 | 314,874 | 273,123 | 236,460 | |||||||||||||||
|
|
|
|
|
|
|
|
|
|
|
|||||||||||
| Cost of revenues: |
||||||||||||||||||||
| Direct payroll costs |
108,800 | 95,128 | 94,568 | 95,439 | 87,679 | |||||||||||||||
| Payroll taxes and benefits |
228,903 | 169,724 | 123,017 | 96,660 | 82,077 | |||||||||||||||
| Workers compensation |
108,617 | 71,086 | 53,837 | 36,284 | 39,765 | |||||||||||||||
|
|
|
|
|
|
|
|
|
|
|
|||||||||||
| Total |
446,320 | 335,938 | 271,422 | 228,383 | 209,521 | |||||||||||||||
|
|
|
|
|
|
|
|
|
|
|
|||||||||||
| Gross margin |
86,524 | 66,714 | 43,452 | 44,740 | 26,939 | |||||||||||||||
| Selling, general and administrativeexpenses |
60,061 | 46,450 | 38,174 | 35,429 | 33,481 | |||||||||||||||
| Depreciation and amortization |
2,037 | 1,477 | 1,344 | 1,395 | 1,641 | |||||||||||||||
|
|
|
|
|
|
|
|
|
|
|
|||||||||||
| Income (loss) from operations |
24,426 | 18,787 | 3,934 | 7,916 | (8,183 | ) | ||||||||||||||
|
|
|
|
|
|
|
|
|
|
|
|||||||||||
| Other income (loss): |
||||||||||||||||||||
| Life insurance proceeds |
0 | 0 | 10,000 | 0 | 0 | |||||||||||||||
| Investment income, net |
723 | 776 | 1,199 | 874 | 1,003 | |||||||||||||||
| Interest expense |
(238 | ) | (76 | ) | (25 | ) | (25 | ) | 0 | |||||||||||
| Other, net |
(9 | ) | (28 | ) | 47 | 1,162 | 637 | |||||||||||||
|
|
|
|
|
|
|
|
|
|
|
|||||||||||
| Total |
476 | 672 | 11,221 | 2,011 | 1,640 | |||||||||||||||
|
|
|
|
|
|
|
|
|
|
|
|||||||||||
| Income (loss) before income taxes |
24,902 | 19,459 | 15,155 | 9,927 | (6,543 | ) | ||||||||||||||
| Provision for (benefit from) income taxes |
7,010 | 6,328 | 837 | 2,574 | (2,598 | ) | ||||||||||||||
|
|
|
|
|
|
|
|
|
|
|
|||||||||||
| Net income (loss) |
$ | 17,892 | $ | 13,131 | $ | 14,318 | $ | 7,353 | $ | (3,945 | ) | |||||||||
|
|
|
|
|
|
|
|
|
|
|
|||||||||||
| Basic earnings (loss) per share |
$ | 2.52 | $ | 1.70 | $ | 1.42 | $ | .71 | $ | (.38 | ) | |||||||||
|
|
|
|
|
|
|
|
|
|
|
|||||||||||
| Weighted average number of basicshares outstanding |
7,105 | 7,723 | 10,083 | 10,333 | 10,452 | |||||||||||||||
|
|
|
|
|
|
|
|
|
|
|
|||||||||||
| Diluted earnings (loss) per share |
$ | 2.42 | $ | 1.67 | $ | 1.41 | $ | .71 | $ | (.38 | ) | |||||||||
|
|
|
|
|
|
|
|
|
|
|
|||||||||||
| Weighted average number of dilutedshares outstanding |
7,397 | 7,863 | 10,150 | 10,372 | 10,452 | |||||||||||||||
|
|
|
|
|
|
|
|
|
|
|
|||||||||||
| Cash dividends per common share |
$ | .57 | $ | .46 | $ | .38 | $ | .33 | $ | .32 | ||||||||||
| Selected balance sheet data: |
||||||||||||||||||||
| Cash and marketable securities |
$ | 119,253 | $ | 72,394 | $ | 81,844 | $ | 61,356 | $ | 57,910 | ||||||||||
| Working capital |
64,421 | 28,142 | 49,639 | 44,563 | 45,301 | |||||||||||||||
| Total assets |
313,322 | 228,861 | 223,097 | 187,884 | 174,616 | |||||||||||||||
| Long-term debt, net of current portion |
5,053 | 5,273 | 0 | 0 | 0 | |||||||||||||||
| Stockholders equity |
72,553 | 53,896 | 101,655 | 95,365 | 94,932 | |||||||||||||||
- 24 -
Table of Contents
| Item 7. | MANAGEMENTS DISCUSSION AND ANALYSIS OF FINANCIAL CONDITION AND RESULTS OF OPERATIONS |
Overview
The Company is a leading provider of business management solutions for small-and mid-sized companies. The Company has developed a management platform that integrates tools from the human resource outsourcing industry and knowledge-based approach from the management consulting industry. This platform, through the effective leveraging of human capital, assists our business owner clients in more effectively running their business.
We deliver the managerial resources and guidance of a large company to small and mid-sized businesses. Our professional employer service fees are generated from client services agreements with our clients; we enter into a co-employment arrangement in which we become the administrative employer and the client maintains care, custody and control of their operations. Revenues from client services agreements are recognized on a net basis in accordance with current accounting guidance for revenue recognition and principal/agent considerations. Consequently, service fee revenues represent the gross margin generated from our professional employer services after deducting the amounts invoiced to co-employed clients for direct payroll expenses such as salaries, wages, health insurance and employee out-of-pocket expenses incurred incidental to employment. These amounts are also excluded from cost of revenues. Our fees also include amounts invoiced to our clients for employer payroll-related taxes and workers compensation coverage.
We generate staffing services revenues primarily from short-term staffing, contract staffing, on-site management and direct placement services. We recognize revenues from our staffing services for all amounts invoiced, including direct payroll, employer payroll-related taxes, workers compensation coverage and a service fee (equivalent to a mark-up percentage).
Through centralized operations at our headquarters in Vancouver, Washington, we prepare invoices weekly for our staffing services customers and following the end of each payroll processing cycle for clients under a client services agreement. We invoice our customers and clients as each payroll is processed. Payment terms for staffing customers are generally 30 days, while co-employed clients invoices are generally due on the invoice date.
Our business is concentrated in California and Oregon and we expect to continue to derive a majority of our revenues from these markets in the future. Revenues generated in our California and Oregon offices accounted for 82% of our total net revenues in 2013, 79% in 2012 and 75% in 2011. Consequently, any weakness in economic conditions or changes in the regulatory environments in these regions could have a material adverse effect on our financial results.
Our cost of revenues is comprised of direct payroll costs for staffing services, employer payroll-related taxes and employee benefits and workers compensation. Direct payroll costs represent the gross payroll earned by staffing services employees based on salary or hourly wages. Payroll taxes and employee benefits consist of the employers portion of Social Security and Medicare taxes, federal and state unemployment taxes, and staffing services employee reimbursements for materials, supplies and other expenses, which are
- 25 -
Table of Contents
paid by the customer. Workers compensation expense consists primarily of the costs associated with our self-insured workers compensation program, such as claims reserves, claims administration fees, legal fees, state administrative agency fees and excess insurance costs for catastrophic injuries. We also maintain separate workers compensation insurance policies for employees working in states where we are not self-insured.
The largest portion of workers compensation expense is the cost of workplace injury claims. When an injury occurs and is reported to us, our respective independent TPA or our internal claims management personnel analyze the details of the injury and develop a case reserve, which becomes the estimate of the cost of the claim based on similar injuries and their professional judgment. We then record or accrue an expense and a corresponding liability based upon our estimate of the ultimate claim cost. As cash payments are made by our TPA against specific case reserves, the accrued liability is reduced by the corresponding payment amount. The TPA and our in-house claims administrators also review existing injury claims on an on-going basis and adjust the case reserves as new or additional information for each claim becomes available. Our reserve includes a provision for both future anticipated increases in costs (adverse loss development) of the claims reserves for open claims and for claims incurred but not reported related to prior and current periods (together IBNR). This provision of the reserve is based upon an actuarial estimate provided by our independent actuary. We believe our operational policies and internal claims reporting system help to limit the occurrence of unreported incurred claims.
Selling, general and administrative expenses represent both branch office and corporate-level operating expenses. Branch operating expenses consist primarily of branch office staff payroll and personnel related costs, advertising, rent, office supplies, professional and legal fees and branch incentive compensation. Corporate-level operating expenses consist primarily of executive and office staff payroll and personnel related costs, professional and legal fees, travel, occupancy costs, information systems costs and executive and corporate staff incentive compensation.
Depreciation and amortization represents depreciation of property and equipment and amortization of intangible assets consisting of the amortization of software costs, covenants not to compete, and if material, customer related intangibles. Property and equipment are depreciated using the straight-line method over their estimated useful lives, which generally range from two to 39 years. Intangible assets are amortized using the straight-line method over their estimated useful lives, which range from two to ten years.
Critical Accounting Policies
We have identified the following policies as critical to our business and the understanding of our results of operations. For a detailed discussion of the application of these and other accounting policies, see Note 1 to the audited consolidated financial statements included in Item 15 of this Report. Note that the preparation of this Annual Report on Form 10-K requires management to make estimates and assumptions that affect the reported amounts of assets and liabilities at the date of the financial statements, and the reported amounts of revenue and expenses during the reporting period. Management bases its estimates on historical experience and on various other assumptions that are believed to be reasonable under the circumstances, the results of which form the basis for making
- 26 -
Table of Contents
judgments about the carrying values of assets and liabilities that are not readily apparent from other sources. Actual results may differ from these estimates under different assumptions or conditions.
Self-Insured Workers Compensation Reserves. We are self-insured for workers compensation coverage in a majority of our employee work sites in Oregon, California, Maryland, Delaware and Colorado and for staffing services and management employees only in Washington. Additionally, effective March 1, 2010, our employees working in Arizona were eligible for coverage through Ecole. The estimated liability for unsettled workers compensation claims represents our best estimate, which includes an evaluation of information provided by our internal claims adjusters and our third-party claims administrators, coupled with managements use of an independent actuary. These elements serve as the basis for our overall estimate for workers compensation claims liabilities, which include more specifically the following components: case reserve estimates for reported losses, plus additional amounts for estimated future development of reported claims and incurred but not reported claims (together IBNR). Our estimates also include amounts for unallocated loss adjustment expenses, including legal costs. These estimates are continually reviewed and adjustments to liabilities are reflected in current operating results as they become known. We believe that the amounts recorded for our estimated liabilities, which are based upon facts and other trends associated with the Companys historical universe of claims data, are reasonable and objective. Nevertheless, it is possible that adjustments to such estimates may be required in future periods if the development of claim costs varies materially from our estimates and such adjustments, if necessary, could be material to results of operations.
Safety Incentives Liability. Our accrued safety incentives represent cash incentives paid to certain clients under our client services agreement for maintaining safe-work practices in order to minimize workplace injuries. The incentive is based on a percentage of annual payroll and is paid annually to customers who meet predetermined workers compensation claims cost objectives. Safety incentive payments are made only after closure of all workers compensation claims incurred during the customers contract period. The liability is estimated and accrued each month based upon the expected payout as determined by historical incentive payment trends. The safety incentive expense is netted against PEO revenues on our Consolidated Statements of Operations.
Allowance for Doubtful Accounts. We are required to make estimates of the collectibility of accounts receivables. Management analyzes historical bad debts, customer concentrations, customer creditworthiness, current economic trends and changes in the customers payment tendencies when evaluating the adequacy of the allowance for doubtful accounts. If the financial condition of our customers deteriorates, resulting in an impairment of their ability to make payments, additional allowances may be required.
Goodwill. We assess the recoverability of goodwill annually and whenever events or changes in circumstances indicate that the carrying value might be impaired. Factors that are considered include significant underperformance relative to expected historical or projected future operating results, significant negative industry trends and significant change in the manner of use of the acquired assets. Managements current assessment of the carrying value of goodwill indicates there was no impairment as of December 31, 2013. If these estimates or their related assumptions change in the future, we may be required to record impairment charges for these assets whenever events or circumstances occur indicating that goodwill might be impaired.
- 27 -
Table of Contents
Investments in Marketable Securities. We consider available evidence in evaluating potential impairment of our investments, including the duration and extent to which fair value is less than cost and our ability and intent to hold the investment. Investments in securities classified as trading are reported at fair value, with unrealized gains or losses reported in other income in our consolidated statements of operations. Investments in securities classified as available-for-sale are reported at fair value, with unrealized gains or losses reported net of tax in other comprehensive income (loss) in stockholders equity. In the event a loss on our available-for-sale investments is determined to be other-than-temporary, the loss will be recognized in our statement of operations. Investments in securities classified as held-to-maturity are reported at amortized cost.
Income Taxes. Our income taxes are accounted for using an asset and liability approach. This requires the recognition of deferred tax assets and liabilities for the expected future tax consequences of temporary differences between the financial statement and tax basis of assets and liabilities at the applicable tax rates. The determination of our provision for income taxes requires significant judgment, the use of estimates, and the interpretation and application of complex tax laws. Significant judgment is required in assessing the timing and amounts of deductible and taxable items and the probability of sustaining uncertain tax positions. The impact of uncertain tax positions would be recorded in our financial statements only after determining a more-likely-than-not probability that the uncertain tax positions would withstand challenge, if any, from taxing authorities. At December 31, 2013, we had deferred income tax assets of $8.9 million. We assess the realization of the deferred income tax assets as significant changes in circumstances may require adjustments during future periods. The amount of the deferred income tax assets actually realized could vary, if there are differences in the timing or amount of future reversals of existing deferred income tax assets or changes in the actual amounts of future taxable income as compared to operating forecasts. If our operating forecast is determined to no longer be reliable due to uncertain market conditions, our long-term forecast may require reassessment. As a result, in the future, a valuation allowance may be required to be established for all or a portion of the deferred income tax assets. Such a valuation allowance could have a significant effect on our future results of operations and financial position.
Recent Accounting Pronouncements
For a discussion of recent accounting pronouncements and their potential effect on the Companys results of operations and financial condition, refer to Note 1 in the Notes to the Consolidated Financial Statements beginning at page F-8 of this Annual Report on Form 10-K.
Forward-Looking Information
Statements in this Item or in Items 1 and 1A of this Report which are not historical in nature, including discussion of economic conditions in the Companys market areas and effect on revenue levels, the potential for and effect of acquisitions, the effect of changes in the Companys mix of services on gross margin, the adequacy of the Companys workers compensation reserves and allowance for doubtful accounts, the effect of the Companys formation and operation of two wholly owned fully licensed insurance subsidiaries and becoming self-insured for certain business risks, the Companys response to changes in California law affecting the Companys ability to be self-insured for workers compensation claims in the state, the effectiveness of the Companys management information systems,
- 28 -
Table of Contents
payment of future dividends and the availability of financing and working capital to meet the Companys funding requirements, are forward-looking statements within the meaning of the Private Securities Litigation Reform Act of 1995. Such forward-looking statements involve known and unknown risks, uncertainties and other factors that may cause the actual results, performance or achievements of the Company or industry to be materially different from any future results, performance or achievements expressed or implied by such forward-looking statements. Such factors with respect to the Company include, the Companys ability to retain current customers, economic trends in the Companys service areas, the potential for material deviations from expected future workers compensation claims experience, the effect of changes in the workers compensation regulatory environment in one or more of the Companys primary markets, the Companys ability to implement its fronted insurance program while maintaining its competitive position in California, difficulties associated with integrating acquired businesses and clients into the Companys operations, collectibility of accounts receivable, the carrying values of deferred income tax assets and goodwill, which may be affected by the Companys future operating results, and the availability of capital or letters of credit necessary to meet state-mandated surety deposit requirements for maintaining the Companys status as a qualified self-insured employer for workers compensation coverage, among others. The Company disclaims any obligation to update any such factors or to publicly announce the result of any revisions to any of the forward-looking statements contained herein to reflect future events or developments.
Results of Operations
The following table sets forth the percentages of total revenues represented by selected items in the Companys Consolidated Statements of Operations for the years ended December 31, 2013, 2012 and 2011, included in Item 15 of this report. References to the Notes to Financial Statements appearing below are to the notes to the Companys Consolidated Financial Statements included in Item 15 of this report.
| Percentage of Total Net Revenues | ||||||||||||
| Year Ended December 31, | ||||||||||||
| 2013 | 2012 | 2011 | ||||||||||
| Revenues: |
||||||||||||
| Professional employer service fees |
73.0 | % | 68.5 | % | 60.4 | % | ||||||
| Staffing services |
27.0 | 31.5 | 39.6 | |||||||||
|
|
|
|
|
|
|
|||||||
| Total |
100.0 | 100.0 | 100.0 | |||||||||
|
|
|
|
|
|
|
|||||||
| Cost of revenues: |
||||||||||||
| Direct payroll costs |
20.4 | 23.6 | 30.0 | |||||||||
| Payroll taxes and benefits |
43.0 | 42.1 | 39.1 | |||||||||
| Workers compensation |
20.4 | 17.7 | 17.1 | |||||||||
|
|
|
|
|
|
|
|||||||
| Total |
83.8 | 83.4 | 86.2 | |||||||||
|
|
|
|
|
|
|
|||||||
| Gross margin |
16.2 | 16.6 | 13.8 | |||||||||
| Selling, general and administrative expenses |
11.2 | 11.5 | 12.1 | |||||||||
| Depreciation and amortization |
0.4 | 0.4 | 0.4 | |||||||||
|
|
|
|
|
|
|
|||||||
| Income from operations |
4.6 | 4.7 | 1.3 | |||||||||
| Other income |
0.1 | 0.1 | 3.5 | |||||||||
|
|
|
|
|
|
|
|||||||
| Income before income taxes |
4.7 | 4.8 | 4.8 | |||||||||
| Provision for income taxes |
1.3 | 1.6 | 0.3 | |||||||||
|
|
|
|
|
|
|
|||||||
| Net income |
3.4 | % | 3.2 | % | 4.5 | % | ||||||
|
|
|
|
|
|
|
|||||||
- 29 -
Table of Contents
We report PEO revenues on a net basis because we are not the primary obligor for the services provided by our co-employed clients to their customers pursuant to our client service agreements. We present for comparison purposes the gross revenues and cost of revenues information for the years ended December 31, 2013 and 2012 set forth in the table below. Although not in accordance with generally accepted accounting principles in the United States (GAAP), management believes this information is more informative as to the level of our business activity and more illustrative of how we manage our operations, including the preparation of our internal operating forecasts, because it presents our PEO services on a basis comparable to our staffing services.
The presentation of revenues on a net basis and the relative contributions of staffing and PEO services revenues can create volatility in our gross margin percentage. The general impact of fluctuations in our revenue mix is described below.
| | A relative increase in PEO services revenue will result in higher gross margin percentage. Improvement in gross margin percentage occurs because incremental client services revenue dollars are reported as revenue net of all related direct costs. |
| | A relative increase in staffing revenues will typically result in a lower gross margin percentage. Staffing revenues are presented at gross with the related direct costs reported in cost of sales. While staffing relationships typically have higher margins than co-employment relationships, an increase in staffing revenues and related costs presented at gross dilutes the impact of the net PEO services revenue on gross margin percentage. |
| (in thousands) |
Year Ended December 31, |
|||||||
| 2013 | 2012 | |||||||
| Revenues: |
||||||||
| Professional employer services |
$ | 2,665,714 | $ | 1,954,207 | ||||
| Staffing services |
143,881 | 126,648 | ||||||
|
|
|
|
|
|||||
| Total revenues |
2,809,595 | 2,080,855 | ||||||
|
|
|
|
|
|||||
| Cost of revenues: |
||||||||
| Direct payroll costs |
2,369,282 | 1,761,984 | ||||||
| Payroll taxes and benefits |
228,903 | 169,724 | ||||||
| Workers compensation |
124,886 | 82,433 | ||||||
|
|
|
|
|
|||||
| Total cost of revenues |
2,723,071 | 2,014,141 | ||||||
|
|
|
|
|
|||||
| Gross margin |
$ | 86,524 | $ | 66,714 | ||||
|
|
|
|
|
|||||
- 30 -
Table of Contents
A reconciliation of non-GAAP gross revenues to net revenues is as follows for the years ended December 31, 2013 and 2012 (in thousands):
| Gross Revenue Reporting Method |
Reclassification | Net Revenue Reporting Method |
||||||||||||||||||||||
| 2013 | 2012 | 2013 | 2012 | 2013 | 2012 | |||||||||||||||||||
| Revenues: |
||||||||||||||||||||||||
| Professional employer services |
$ | 2,665,714 | $ | 1,954,207 | $ | (2,276,751 | ) | $ | (1,678,203 | ) | $ | 388,963 | $ | 276,004 | ||||||||||
| Staffing services |
143,881 | 126,648 | 0 | 0 | 143,881 | 126,648 | ||||||||||||||||||
|
|
|
|
|
|
|
|
|
|
|
|
|
|||||||||||||
| Total revenues |
$ | 2,809,595 | $ | 2,080,855 | $ | (2,276,751 | ) | $ | (1,678,203 | ) | $ | 532,844 | $ | 402,652 | ||||||||||
|
|
|
|
|
|
|
|
|
|
|
|
|
|||||||||||||
| Cost of revenues: |
$ | 2,723,071 | $ | 2,014,141 | $ | (2,276,751 | ) | $ | (1,678,203 | ) | $ | 446,320 | $ | 335,938 | ||||||||||
|
|
|
|
|
|
|
|
|
|
|
|
|
|||||||||||||
The amount of the reclassification is comprised of direct payroll costs and safety incentives attributable to our PEO client companies.
Years Ended December 31, 2013 and 2012
Net income for 2013 amounted to $17.9 million, as compared to net income of $13.1 million for 2012. Net income in 2013 was primarily driven by a 32.3% increase in revenues. Diluted income per share for 2013 was $2.42 compared to a diluted income per share of $1.67 for 2012. 2013 reflected nearly 500,000 fewer diluted common shares outstanding compared to 2012 primarily due to the Companys repurchase of approximately 2.5 million shares from the Estate of William W. Sherertz, as well as 500,000 shares from Nancy Sherertz on March 28, 2012.
Revenues for 2013 totaled $532.8 million, an increase of approximately $130.2 million or 32.3%, which reflects an increase in both the Companys PEO service fee revenue and staffing services revenue. PEO service fee revenue increased approximately $113.0 million or 40.9% over 2012 primarily due to growth in new customers as co-employment based business from new customers during 2013 tripled our lost PEO business from former customers. PEO service revenue from continuing customers grew 10.2% on a year-over-year basis primarily resulting from increases in employee headcount and hours worked. Staffing services revenue increased approximately $17.2 million or 13.6% over 2012 due to growth in new customers as well as an increase in revenue from existing customers. Approximately 74% and 69%, respectively, of our revenue during 2013 and 2012 was attributable to our California operations.
During 2013, the Company served approximately 3,200 co-employment clients, which compares to approximately 2,910 co-employment clients during 2012. During 2013, the Company served approximately 1,870 staffing service customers, which compares to 1,850 during 2012.
Gross margin for 2013 totaled approximately $86.5 million, which represented an increase of $19.8 million or 29.7% over 2012, primarily due to the 32.3% increase in revenues and a decline in direct payroll costs as a percentage of revenues, partially offset by higher payroll taxes and benefits and workers compensation expense as a percentage of revenues. The gross margin percent decreased from 16.6% of revenues for 2012 to 16.2% for 2013. The increase in payroll taxes and benefits, as a percentage of revenues, from 42.1% for 2012
- 31 -
Table of Contents
to 43.0% for 2013, was principally due to a relative shift in business mix to PEO services, as to which payroll taxes and benefits are presented at gross cost while the related direct payroll costs are netted against PEO services revenue and to higher effective state unemployment tax rates in various states in which the Company operated in 2013 as compared to 2012. Workers compensation expense for 2013 totaled $108.6 million, which compares to $71.1 million for 2012. Workers compensation expense, as a percent of revenues, increased from 17.7% in 2012 to 20.4% in 2013. The increase in the percentage rate was primarily driven by an increase in the provision for claim costs related to current year claims and increases in the estimated costs to close prior year claims and higher insurance broker commissions resulting from increased workers compensation insurance rates. The decrease in direct payroll costs, as a percentage of revenues, from 23.6% for 2012 to 20.4% for 2013 was primarily due to the increase in our mix of PEO services in the Companys customer base compared to 2012 and the effect of each customers unique mark-up percent. We expect gross margin as a percentage of total revenues to continue to be influenced by fluctuations in the mix between staffing and PEO services, as well as changes to our estimates for workers compensation claims liabilities, as necessary.
Selling, general and administrative (SG&A) expenses consist of compensation and other expenses relating to the operation of our headquarters and our branch offices and the marketing of our services. SG&A expenses for 2013 amounted to approximately $60.1 million, an increase of $13.6 million or 29.3% over 2012. The increase was primarily attributable to an increase in management payroll and other variable expense components within SG&A to support the business growth and to higher incentive pay based on increased branch performance. SG&A expenses, as a percentage of revenues, decreased from 11.5% in 2012 to 11.2% in 2013.
Other income for 2013 was $476,000 compared to other income of $672,000 for 2012. Other income for 2013 was primarily attributable to investment income earned on the Companys cash and marketable securities.
Our effective income tax rate for 2013 was 28.2%, as compared to 32.5% for 2012. Our income tax rate typically differs from the statutory tax rate of 39% primarily due to federal and state employment tax credits. Refer to Note 11 in the Notes to the Consolidated Financial Statements on page F-23 of this Annual Report on Form 10-K regarding income taxes.
In September 2012, California Senate Bill 863 (SB 863) was signed into law. Under SB 863, the California Director of Self-Insurance was ordered not to issue certificates of consent to self-insure after January 1, 2013 to any employer engaged in the activities of a professional employer organization, a leasing employer, a temporary services employer or any employer the Director determines to be in the business of providing employees to other employers. Additionally, the Director is required to revoke any previously issued certificate of consent to self-insure in favor of any employer engaged in these types of activities not later than January 1, 2015. To address this issue, BBSI has entered into an arrangement typically known as a fronted program with ACE Group. Under this arrangement, the risk of loss up to the first $5.0 million per claim will be retained by BBSI through an indemnity agreement, although ACE will be responsible for any claims BBSI is unable to satisfy. In addition, ACE continues to be BBSIs carrier for costs in excess of $5.0 million per claim. During 2014, we will transition to the ACE program so that by December 31, 2014, all of our employees
- 32 -
Table of Contents
working in California will be covered by this new arrangement. We expect to incur increased costs during this transition that will likely continue following implementation of the fronted insurance program.
Years Ended December 31, 2012 and 2011
Net income for 2012 amounted to $13.1 million, as compared to net income of $14.3 million for 2011. Net income in 2012 was primarily driven by a 27.9% increase in revenues and a higher margin percentage as compared to 2011. Net income in 2011 included $10.0 million of key man life insurance proceeds received following the passing of the Companys former president and CEO and the related benefit of a lower annual effective income tax rate. Diluted income per share for 2012 was $1.67 compared to a diluted income per share of $1.41 for 2011.
Revenues for 2012 totaled $402.7 million, an increase of approximately $87.8 million or 27.9%, which reflects an increase in the Companys PEO service fee revenue and a small increase in staffing services revenue. PEO service fee revenue increased approximately $85.9 million or 45.2% over 2011 primarily due to growth in new customers as co-employment based business from new customers during 2012 more than tripled our lost PEO business from former customers. PEO service revenue from continuing customers grew 7.3% on a year-over-year basis. Staffing services revenue increased approximately $1.9 million or 1.5% over 2011 primarily due to an increase in revenue from existing customers as the addition of new business nearly offset lost business from former customers.
During 2012, the Company served approximately 2,910 co-employment clients, which compares to approximately 2,355 co-employment clients during 2011. During 2012, the Company served approximately 1,850 staffing service customers, which compares to 1,815 during 2011.
Gross margin for 2012 totaled approximately $66.7 million, which represented an increase of $23.3 million or 53.5% over 2011, primarily due to the 27.9% increase in revenues and a decline in direct payroll costs as a percentage of revenues, partially offset by higher payroll taxes and benefits and workers compensation expense as a percentage of revenues. The gross margin percent increased from 13.8% of revenues for 2011 to 16.6% for 2012. The decrease in direct payroll costs, as a percentage of revenues, from 30.0% for 2011 to 23.6% for 2012 was primarily due to the increase in our mix of PEO services in the Companys customer base compared to 2011 and the effect of each customers unique mark-up percent. The increase in payroll taxes and benefits, as a percentage of revenues, from 39.1% for 2011 to 42.1% for 2012, was principally due to a relative shift in business mix to PEO services, as to which payroll taxes and benefits are presented at gross cost while the related direct payroll costs are netted against PEO services revenue and to higher effective state unemployment tax rates in various states in which the Company operated in 2012 as compared to 2011. Workers compensation expense for 2012 totaled $71.1 million, which compares to $53.8 million for 2011. Workers compensation expense, as a percent of revenues, increased from 17.1% in 2011 to 17.7% in 2012. The increase in the percentage rate was primarily driven by an increase in the provision for claim costs related to current year claims and increases in estimated costs to close prior year claims and higher insurance broker commissions resulting from increased workers compensation insurance rates.
- 33 -
Table of Contents
SG&A expenses for 2012 amounted to approximately $46.5 million, an increase of $8.3 million or 21.7% over 2011. The increase was primarily attributable to an increase in management payroll and other variable expense components within SG&A to support the business growth and to higher incentive pay based on increased branch performance. SG&A expenses, as a percentage of revenues, decreased from 12.1% in 2011 to 11.5% in 2012.
Other income for 2012 was $672,000 compared to other income of $11.2 million for 2011. Other income for 2012 was primarily attributable to investment income earned on the Companys cash and marketable securities. Other income for 2011 included the $10.0 million of key man life insurance proceeds received following the death of our founder and CEO and approximately $1.2 million of investment income.
Our effective income tax rate for 2012 was 32.5%, as compared to 5.5% for 2011. The 2011 provision for income taxes included a favorable benefit from the effect of the non-taxable $10.0 million life insurance proceeds.
Fluctuations in Quarterly Operating Results
We have historically experienced significant fluctuations in our quarterly operating results and expect such fluctuations to continue in the future. Our operating results may fluctuate due to a number of factors such as a seasonality, wage limits on statutory payroll taxes, claims experience for workers compensation, demand for our services and competition and the effect of acquisitions. Payroll taxes, as a component of cost of revenues, generally decline throughout a calendar year as the applicable statutory wage bases for federal and state unemployment taxes and Social Security taxes are exceeded on a per employee basis. Our revenue levels may be higher in the third quarter due to the effect of increased business activity of our customers businesses in the agriculture, food processing and forest products-related industries. In addition, revenues in the fourth quarter may be affected by many customers practice of operating on holiday-shortened schedules. Workers compensation expense varies with both the frequency and severity of workplace injury claims reported during a quarter and the estimated future costs of such claims. In addition, adverse loss development of prior period claims during a subsequent quarter may also contribute to the volatility in the Companys estimated workers compensation expense.
Liquidity and Capital Resources
The Companys cash position of $93.6 million at December 31, 2013 increased $47.8 million compared to December 31, 2012, which compares to a decrease of $3.8 million for the year ended December 31, 2012. The increase in cash at December 31, 2013, as compared to December 31, 2012, was primarily due to net income of $17.9 million together with increases in workers compensation claims liabilities of $41.9 million, accrued payroll, payroll taxes and related benefits of $22.9 million, partially offset by an increase in accounts receivable of $21.7 million, and net purchases of restricted certificates of deposits of $12.8 million.
Net cash provided by operating activities for 2013 amounted to $70.1 million, as compared to net cash provided by operating activities of $45.7 million for 2012. For 2013, cash flow was primarily provided by net income of $17.9 million, together with increases in workers compensation claims liabilities of $41.9 million, accrued payroll, payroll taxes and related benefits of $22.9 million, safety incentives liabilities of $3.2 million, partially offset by an increase in accounts receivable of $21.7 million.
- 34 -
Table of Contents
Net cash used in investing activities totaled $17.4 million for 2013, compared to net cash provided by investing activities of $2.1 million for 2012. For 2013, the cash used in investing activities was primarily used for net purchases of restricted certificates of deposits of $12.8 million and by purchases of property and equipment of $4.1 million. The $11.4 million purchases of restricted marketable securities was nearly offset by the $9.9 million proceeds from the maturities of restricted marketable securities. These transactions were for scheduled maturities and the replacement of such securities held for workers compensation surety deposit purposes. The $60.9 million proceeds from the sales and maturities of marketable securities were nearly offset by the $59.9 million purchase of marketable securities. The Company presently has no material long-term capital commitments.
The Companys investment policy strictly defines the types and quantities of investments that can be made by its investment brokers. The general parameters of our investment policy are as follows:
| | We make investments in highly rated instruments to reduce our investment risk. Short-term instruments (maturity of less than one year) must be obligations of issuers rated A2/P2 or better by two National Recognized Statistical Rating Organizations. Long-term instruments (maturities greater than one year) must be obligations of issuers rated BBB-/Baa3 or better by two National Recognized Statistical Rating Organizations. |
| | No more than 5% of our investment portfolio is invested in any one issuer (excluding U.S. Treasury obligations and Federal Agency obligations including Government Sponsored Enterprises). |
To monitor our overall investment risk and to assess the fair values of assets within our investment portfolio, we review our investment portfolio on a quarterly basis for significant unrealized gains or losses. We define significant to be in excess of 5% of cost basis. When we identify significant unrealized gains or losses, we inquire as to the reasons with our investment advisor.
Net cash used in financing activities for 2013 was $4.9 million compared to net cash used in financing activities of $51.6 million for 2012. For 2013, the principal uses of cash for financing activities was the net payments on debt totaling $4.8 million and the payment of regular quarterly cash dividends totaling $4.1 million to holders of the Companys common stock, partially offset by $3.9 million from the exercise of stock options and the associated excess tax benefits from share-based compensation.
The Companys business strategy continues to focus on growth through the expansion of operations at existing branch offices, together with the possibility of selective acquisition of additional personnel-related business, both in its existing markets and other strategic geographic markets. The Company periodically evaluates proposals for various acquisition opportunities, but there can be no assurance that any additional transactions will be consummated.
As disclosed in Note 7 to the Consolidated Financial Statements in this report, the Company maintains a credit agreement (the Agreement) with its principal bank, Wells Fargo Bank, National Association (the Bank). The Agreement, which expires October 1, 2017,
- 35 -
Table of Contents
provides for a revolving credit facility with a current borrowing capacity of up to $19.0 million. The Company had no outstanding borrowings on the revolving credit facility at December 31, 2013. The Agreement also provides for the continuance of existing standby letters of credit in connection with various surety deposit requirements for workers compensation purposes, as to which the amount outstanding totaled approximately $19.4 million as of December 31, 2013.
The states of California, Oregon, Maryland, Washington, Delaware and Colorado require us to maintain specified investment balances or other financial instruments, totaling $72.9 million at December 31, 2013 to cover potential workers compensation claims losses relating to the Companys status as a self-insured employer. In partial satisfaction of these requirements, at December 31, 2013, we have provided surety bonds and standby letters of credit totaling $70.8 million. The State of California requires the Company to maintain a surety deposit of $63.9 million (which is included in the total $70.8 million of surety bonds and standby letters of credit), which the Company satisfied through the posting of third party issued surety bonds, backed by a $12.8 million letter of credit. In conjunction with this letter of credit, the Company posted $12.8 million of certificates of deposit with Wells Fargo as collateral. The $12.8 million letter of credit is included in the total $19.4 million of standby letters of credit with Wells Fargo.
Advances under the revolving credit facility bear interest, at the Companys option, at either (a) a fixed rate for a term selected by the Company from time-to-time or (b) a fluctuating rate. In each case, the rate is calculated based on LIBOR plus 1.75%. The Agreement also provides for an unused commitment fee of 0.25% per annum on the average daily unused amount of the revolving credit facility.
The credit facility is collateralized by the Companys accounts receivable and other rights to receive payment, general intangibles and equipment. Under the Agreement, the maximum principal amount available is reduced by $2.5 million every six months commencing April 1, 2013.
The Agreement, as amended, requires the satisfaction of certain financial covenants as follows:
| | minimum Fixed Charge Coverage ratio of no less than 1.25:1.0, measured quarterly on a rolling four-quarter basis; |
| | funded Debt: EBITDA of no more than 1.75:1 through September 30, 2014; 1.5:1 through September 30, 2015; and 1.25:1 thereafter, measured quarterly on a rolling four-quarter basis; |
| | ratio of restricted and unrestricted cash and marketable securities to workers compensation and safety incentive liabilities of at least 1.0:1.0, measured quarterly; and |
| | prohibition on incurring additional indebtedness without the prior approval of the Bank, other than up to $200,000 per year in purchase money financing. |
The Agreement also contains customary events of default. If an event of default under the Agreement occurs and is continuing, the Bank may declare any outstanding
- 36 -
Table of Contents
obligations under the Agreement to be immediately due and payable. The Company was in compliance with all applicable financial covenants at December 31, 2013.
Additionally, as disclosed in Note 7 to the Consolidated Financial Statements in this report, the Company maintains a term loan with the Bank for approximately $5.3 million secured by the Companys corporate office building in Vancouver, Washington. The term loan requires payment of monthly installments of $18,375 bearing interest at the one month LIBOR plus 2.25% with the unpaid principal balance due November 1, 2017.
The Company is self-insured for certain business insurance risks such as general liability, errors and omissions and umbrella coverage. Management may explore in the future whether to pursue other vehicles to provide coverage including coverages provided by the Companys captive insurance companies.
Management expects that the funds anticipated to be generated from operations, current liquid assets, and availability under its revolving credit facility will be sufficient in the aggregate to fund the Companys working capital needs for the next twelve months.
Contractual Obligations
The Companys contractual obligations as of December 31, 2013, including commitments for future payments under non-cancelable lease arrangements, long-term workers compensation liabilities for catastrophic injuries, long-term debt, and other long-term liabilities, are summarized below:
| Payments Due by Period | ||||||||||||||||||||
| (in thousands) | Total |
Less than 1 year |
1 - 3 years |
4 - 5 years |
After 5 years |
|||||||||||||||
| Operating leases |
$ | 9,108 | $ | 2,941 | $ | 4,450 | $ | 1,704 | $ | 13 | ||||||||||
| Long-term workers compensation claims liabilities for catastrophic injuries |
331 | 60 | 82 | 64 | 125 | |||||||||||||||
| Long-term debt |
5,273 | 220 | 441 | 4,612 | 0 | |||||||||||||||
|
|
|
|
|
|
|
|
|
|
|
|||||||||||
| Total contractual cash obligations |
$ | 14,712 | $ | 3,221 | $ | 4,973 | $ | 6,380 | $ | 138 | ||||||||||
|
|
|
|
|
|
|
|
|
|
|
|||||||||||
Inflation
Inflation generally has not been a significant factor in the Companys operations during the periods discussed above. The Company has taken into account the impact of escalating medical and other costs in establishing reserves for future expenses for self-insured workers compensation claims.
| Item 7A. | QUANTITATIVE AND QUALITATIVE DISCLOSURES ABOUT MARKET RISK |
The Companys exposure to market risk for changes in interest rates primarily relates to its investment portfolio of liquid assets and its outstanding borrowings on its line of credit and long-term debt. As of December 31, 2013, the Companys investment portfolio consisted principally of approximately $66.3 million in tax-exempt money market funds, $8.8 million in tax-exempt municipal bonds, and approximately $24.5 million in corporate bonds. The Companys outstanding long-term debt totaled approximately $5.3 million at
- 37 -
Table of Contents
December 31, 2013. Based on the Companys overall interest exposure at December 31, 2013, a 100 basis point increase in market interest rates would not have a material effect on the fair value of the Companys investment portfolio of liquid assets, its outstanding borrowings or its results of operations because of the predominantly short maturities of the securities within the investment portfolio and the relative size of the outstanding borrowings.
| Item 8. | FINANCIAL STATEMENTS AND SUPPLEMENTARY DATA |
The financial statements and notes thereto required by this item begin on page F-1 of this report, as listed in Item 15.
| Item 9. | CHANGES IN AND DISAGREEMENTS WITH ACCOUNTANTS ON ACCOUNTING AND FINANCIAL DISCLOSURE |
None.
| Item 9A. | CONTROLS AND PROCEDURES |
Evaluation of Disclosure Controls and Procedures
Our management, with the participation of our Chief Executive Officer and Chief Financial Officer, evaluated the effectiveness of our disclosure controls and procedures as defined in Exchange Act Rule 13a-15(e) as of December 31, 2013 in connection with the filing of this Annual Report on Form 10-K. Based on that evaluation, our Chief Executive Officer and Chief Financial Officer concluded that, as of December 31, 2013, our disclosure controls and procedures were effective to ensure that information we are required to disclose in reports that we file or submit under the Exchange Act is recorded, processed, summarized and reported within the time periods specified in rules and forms of the SEC and is accumulated and communicated to our management as appropriate to allow timely decisions regarding required disclosure.
Managements Annual Report on Internal Control over Financial Reporting
Our management is responsible for establishing and maintaining for our Company adequate internal control over financial reporting as defined in Rules 13a-15(e) and 15d-15(e) under the Exchange Act. Our management, with the participation of our Chief Executive Officer and Chief Financial Officer, conducted an evaluation of the effectiveness of our internal control over financial reporting as of December 31, 2013. This evaluation was based on the framework established in Internal ControlIntegrated Framework (1992) issued by the Committee of Sponsoring Organizations of the Treadway Commission (COSO).
Based upon this evaluation and the criteria noted above, management has concluded that, as of December 31, 2013, our internal control over financial reporting was effective.
The effectiveness of our internal control over financial reporting as of December 31, 2013 has been audited by Moss Adams LLP, the Companys independent registered public accounting firm, as stated in their report which appears on page F-1 of Item 15 in this Annual Report on Form 10-K.
- 38 -
Table of Contents
Changes in Internal Control over Financial Reporting
There were no changes in our internal control over financial reporting during the fourth quarter of 2013 that have materially affected, or are reasonably likely to materially affect, our internal control over financial reporting.
Inherent Limitations
Control systems, no matter how well designed and operated, can provide only reasonable, not absolute, assurance that the control systems objectives are being met. Further, the design of any control systems must reflect the fact that there are resource constraints, and the benefits of all controls must be considered relative to their costs. Because of the inherent limitations in all control systems, no evaluation of controls can provide absolute assurance that all control issues and instances of fraud, if any, within our Company have been detected. These inherent limitations include the realities that judgments in decision making can be faulty and that breakdowns can occur because of simple errors or mistakes. Control systems can also be circumvented by the individual acts of some persons, by collusion of two or more people, or by management override of the controls. The design of any system of controls is based in part on certain assumptions about the likelihood of future events, and there can be no assurance that any design will succeed in achieving its stated goals under all potential future conditions. Over time, controls may become inadequate because of changes in conditions or deterioration in the degree of compliance with policies or procedures.
- 39 -
Table of Contents
| Item 9B. | OTHER INFORMATION |
None.
- 40 -
Table of Contents
PART III
| Item 10. | DIRECTORS, EXECUTIVE OFFICERS AND CORPORATE GOVERNANCE |
Information required by this Item 10 concerning directors and executive officers of the Company appears under the heading Executive Officers of the Registrant on page 20 of this report or is incorporated into this report by reference to the Companys definitive Proxy Statement for its 2013 Annual Meeting of Stockholders to be filed within 120 days of the Companys fiscal year end of December 31, 2013 (the Proxy Statement). The additional required information is included under the following headings of the Proxy Statement; Item 1 Election of Directors, Stock Ownership by Principal Stockholders and ManagementSection 16(a) Beneficial Ownership Reporting Compliance, and Code of Ethics.
Audit Committee
The Company has a separately-designated standing audit committee established in accordance with Section 3(a)(58)(A) of the Exchange Act known as the Audit and Compliance Committee. The members of the Audit and Compliance Committee are Thomas J. Carley, chairman, James B. Hicks, Ph.D., Anthony Meeker and Roger L. Johnson, each of whom is independent as that term is used in Nasdaq listing standards applicable to the Company.
Audit Committee Financial Expert
The Companys Board of Directors has determined that Thomas J. Carley, an audit committee member, qualifies as an audit committee financial expert as defined by Item 407(d)(5) of Regulation S-K under the Exchange Act and is independent as that term is defined for audit committee members in Nasdaq listing standards applicable to the Company.
| Item 11. | EXECUTIVE COMPENSATION |
Information required by this Item 11 concerning executive and director compensation and participation of compensation committee members is incorporated into this report by reference to the Proxy Statement, in which required information is included under the heading Executive Compensation.
| Item 12. | SECURITY OWNERSHIP OF CERTAIN BENEFICIAL OWNERS AND MANAGEMENT AND RELATED STOCKHOLDER MATTERS |
Information required by this Item 12 concerning the security ownership of certain beneficial owners and management is incorporated into this report by reference to the Proxy Statement, in which required information is set forth under the headings Stock Ownership of Principal Stockholders and Management Beneficial Ownership Table and Equity Compensation Plan Information.
- 41 -
Table of Contents
| Item 13. | CERTAIN RELATIONSHIPS AND RELATED TRANSACTIONS, AND DIRECTOR INDEPENDENCE |
Information required by this Item 13 concerning certain relationships and related transactions and director independence is incorporated into this report by reference to the Proxy Statement, in which required information is included under the headings Item 1 Election of Directors and Related Person Transactions.
| Item 14. | PRINCIPAL ACCOUNTANT FEES AND SERVICES |
Information required by this Item 14 concerning fees paid to our accountants is incorporated into this report by reference to the Proxy Statement, in which required information is included under the heading Matters Relating to Our Independent Registered Public Accounting Firm.
- 42 -
Table of Contents
PART IV
| Item 15. | EXHIBITS AND FINANCIAL STATEMENT SCHEDULES |
Financial Statements and Schedules
The Financial Statements, together with the report thereon of Moss Adams LLP, are included on the pages indicated below:
No schedules are required to be filed herewith.
Exhibits
Exhibits are listed in the Exhibit Index that follows the signature page of this report.
- 43 -
Table of Contents
REPORT OF INDEPENDENT REGISTERED PUBLIC ACCOUNTING FIRM
The Board of Directors and Stockholders
Barrett Business Services, Inc.
We have audited the accompanying consolidated balance sheets of Barrett Business Services, Inc. (the Company) as of December 31, 2013 and 2012, and the related consolidated statements of operations, comprehensive income, stockholders equity and cash flows for each of the three years in the period ended December 31, 2013. We also have audited the Companys internal control over financial reporting as of December 31, 2013, based on criteria established in Internal ControlIntegrated Framework (1992) issued by the Committee of Sponsoring Organizations of the Treadway Commission (COSO). The Companys management is responsible for these financial statements, for maintaining effective internal control over financial reporting, and for its assessment of the effectiveness of internal control over financial reporting, included in the accompanying Managements Annual Report on Internal Control over Financial Reporting located in Item 9A. Our responsibility is to express an opinion on these consolidated financial statements and an opinion on the Companys internal control over financial reporting based on our audits.
We conducted our audits in accordance with the standards of the Public Company Accounting Oversight Board (United States). Those standards require that we plan and perform the audits to obtain reasonable assurance about whether the consolidated financial statements are free of material misstatement and whether effective internal control over financial reporting was maintained in all material respects. Our audits of the consolidated financial statements included examining, on a test basis, evidence supporting the amounts and disclosures in the consolidated financial statements, assessing the accounting principles used and significant estimates made by management, and evaluating the overall consolidated financial statement presentation. Our audit of internal control over financial reporting included obtaining an understanding of internal control over financial reporting, assessing the risk that a material weakness exists, and testing and evaluating the design and operating effectiveness of internal control based on the assessed risk. Our audits also included performing such other procedures as we considered necessary in the circumstances. We believe that our audits provide a reasonable basis for our opinions.
A companys internal control over financial reporting is a process designed to provide reasonable assurance regarding the reliability of financial reporting and the preparation of financial statements for external purposes in accordance with generally accepted accounting principles. A companys internal control over financial reporting includes those policies and procedures that (1) pertain to the maintenance of records that, in reasonable detail, accurately and fairly reflect the transactions and dispositions of the assets of the company; (2) provide reasonable assurance that transactions are recorded as necessary to permit preparation of financial statements in accordance with generally accepted accounting principles, and that receipts and expenditures of the company are being made only in accordance with the authorizations of management and directors of the company; and (3) provide reasonable assurance regarding prevention or timely detection of unauthorized acquisition, use, or disposition of the companys assets that could have a material effect on the financial statements.
Because of its inherent limitations, internal control over financial reporting may not prevent or detect misstatements. Also, projections of any evaluation of effectiveness to future periods are subject to the risk that controls may become inadequate because of changes in conditions, or that the degree of compliance with the policies and procedures may deteriorate.
F-1
Table of Contents
In our opinion, the consolidated financial statements referred to above present fairly, in all material respects, the consolidated financial position of Barrett Business Services, Inc. as of December 31, 2013 and 2012, and the consolidated results of its operations and its cash flows for each of the three years in the period ended December 31, 2013, in conformity with generally accepted accounting principles in the United States of America. Also in our opinion, Barrett Business Services, Inc. maintained, in all material respects, effective internal control over financial reporting as of December 31, 2013, based on criteria established in Internal ControlIntegrated Framework (1992) issued by the Committee of Sponsoring Organizations of the Treadway Commission.
/s/ Moss Adams LLP
Portland, Oregon
March 14, 2014
F-2
Table of Contents
Barrett Business Services, Inc.
Consolidated Balance Sheets
December 31, 2013 and 2012
(In Thousands, Except Par Value)
| 2013 | 2012 | |||||||
| ASSETS | ||||||||
| Current assets: |
||||||||
| Cash and cash equivalents |
$ | 93,557 | $ | 45,747 | ||||
| Marketable securities |
19,787 | 16,748 | ||||||
| Trade accounts receivable, net |
85,586 | 63,921 | ||||||
| Prepaid expenses and other |
3,026 | 4,854 | ||||||
| Deferred income taxes |
8,929 | 8,148 | ||||||
|
|
|
|
|
|||||
| Total current assets |
210,885 | 139,418 | ||||||
| Marketable securities |
5,909 | 9,899 | ||||||
| Property, equipment and software, net |
20,549 | 18,489 | ||||||
| Restricted certificates of deposit |
12,789 | 0 | ||||||
| Restricted marketable securities and workers compensation deposits |
11,205 | 9,726 | ||||||
| Other assets |
1,864 | 1,833 | ||||||
| Workers compensation receivables for insured losses and recoveries |
2,301 | 1,676 | ||||||
| Goodwill |
47,820 | 47,820 | ||||||
|
|
|
|
|
|||||
| $ | 313,322 | $ | 228,861 | |||||
|
|
|
|
|
|||||
| LIABILITIES AND STOCKHOLDERS EQUITY | ||||||||
| Current liabilities: |
||||||||
| Current portion of long-term debt |
$ | 220 | $ | 220 | ||||
| Line of credit |
0 | 4,532 | ||||||
| Accounts payable |
3,252 | 1,995 | ||||||
| Accrued payroll, payroll taxes and related benefits |
92,516 | 69,568 | ||||||
| Income taxes payable |
1,236 | 272 | ||||||
| Other accrued liabilities |
313 | 306 | ||||||
| Workers compensation claims liabilities |
35,841 | 24,541 | ||||||
| Safety incentives liability |
13,086 | 9,842 | ||||||
|
|
|
|
|
|||||
| Total current liabilities |
146,464 | 111,276 | ||||||
| Long-term workers compensation claims liabilities |
76,603 | 46,023 | ||||||
| Long-term debt |
5,053 | 5,273 | ||||||
| Deferred income taxes |
10,787 | 10,607 | ||||||
| Customer deposits and other long-term liabilities |
1,862 | 1,786 | ||||||
| Commitments and contingencies (Notes 7, 9 and 14) |
||||||||
| Stockholders equity: |
||||||||
| Common stock, $.01 par value; 20,500 shares authorized, 7,165 and 7,017 shares issued and outstanding |
72 | 70 | ||||||
| Additional paid-in capital |
5,781 | 913 | ||||||
| Accumulated other comprehensive (loss) income |
(26 | ) | 23 | |||||
| Retained earnings |
66,726 | 52,890 | ||||||
|
|
|
|
|
|||||
| 72,553 | 53,896 | |||||||
|
|
|
|
|
|||||
| $ | 313,322 | $ | 228,861 | |||||
|
|
|
|
|
|||||
The accompanying notes are an integral part of these financial statements.
F-3
Table of Contents
Barrett Business Services, Inc.
Consolidated Statements of Operations
Years Ended December 31, 2013, 2012 and 2011
(In Thousands, Except Per Share Amounts)
| 2013 | 2012 | 2011 | ||||||||||
| Revenues: |
||||||||||||
| Professional employer service fees |
$ | 388,963 | $ | 276,004 | $ | 190,113 | ||||||
| Staffing services |
143,881 | 126,648 | 124,761 | |||||||||
|
|
|
|
|
|
|
|||||||
| 532,844 | 402,652 | 314,874 | ||||||||||
|
|
|
|
|
|
|
|||||||
| Cost of revenues: |
||||||||||||
| Direct payroll costs |
108,800 | 95,128 | 94,568 | |||||||||
| Payroll taxes and benefits |
228,903 | 169,724 | 123,017 | |||||||||
| Workers compensation |
108,617 | 71,086 | 53,837 | |||||||||
|
|
|
|
|
|
|
|||||||
| 446,320 | 335,938 | 271,422 | ||||||||||
|
|
|
|
|
|
|
|||||||
| Gross margin |
86,524 | 66,714 | 43,452 | |||||||||
| Selling, general and administrative expenses |
60,061 | 46,450 | 38,174 | |||||||||
| Depreciation and amortization |
2,037 | 1,477 | 1,344 | |||||||||
|
|
|
|
|
|
|
|||||||
| Income from operations |
24,426 | 18,787 | 3,934 | |||||||||
|
|
|
|
|
|
|
|||||||
| Other income (expense): |
||||||||||||
| Life insurance proceeds |
0 | 0 | 10,000 | |||||||||
| Investment income |
723 | 776 | 1,199 | |||||||||
| Interest expense |
(238 | ) | (76 | ) | (25 | ) | ||||||
| Other |
(9 | ) | (28 | ) | 47 | |||||||
|
|
|
|
|
|
|
|||||||
| 476 | 672 | 11,221 | ||||||||||
|
|
|
|
|
|
|
|||||||
| Income before income taxes |
24,902 | 19,459 | 15,155 | |||||||||
| Provision for income taxes |
7,010 | 6,328 | 837 | |||||||||
|
|
|
|
|
|
|
|||||||
| Net income |
$ | 17,892 | $ | 13,131 | $ | 14,318 | ||||||
|
|
|
|
|
|
|
|||||||
| Basic earnings per share |
$ | 2.52 | $ | 1.70 | $ | 1.42 | ||||||
|
|
|
|
|
|
|
|||||||
| Weighted average number of basic shares outstanding |
7,105 | 7,723 | 10,083 | |||||||||
|
|
|
|
|
|
|
|||||||
| Diluted earnings per share |
$ | 2.42 | $ | 1.67 | $ | 1.41 | ||||||
|
|
|
|
|
|
|
|||||||
| Weighted average number of diluted shares outstanding |
7,397 | 7,863 | 10,150 | |||||||||
|
|
|
|
|
|
|
|||||||
| Cash dividends per common share |
$ | .57 | $ | .46 | $ | .38 | ||||||
The accompanying notes are an integral part of these financial statements.
F-4
Table of Contents
Barrett Business Services, Inc.
Consolidated Statements of Comprehensive Income
Years Ended December 31, 2013, 2012 and 2011
(In Thousands)
| For the year ended December 31, | ||||||||||||
| 2013 | 2012 | 2011 | ||||||||||
| Net income |
17,892 | $ | 13,131 | $ | 14,318 | |||||||
| Unrealized (losses) gains on marketable securities, net of tax of ($31), $36, and $20 in 2013, 2012and 2011, respectively |
(49 | ) | 57 | 31 | ||||||||
|
|
|
|
|
|
|
|||||||
| Comprehensive income |
$ | 17,843 | $ | 13,188 | $ | 14,349 | ||||||
|
|
|
|
|
|
|
|||||||
The accompanying notes are an integral part of these financial statements.
F-5
Table of Contents
Barrett Business Services, Inc.
Consolidated Statements of Stockholders Equity
Years Ended December 31, 2013, 2012 and 2011
(In Thousands)
|
Additional Paid-in Capital |
Accumulated Other Comprehensive (Loss) Income |
Retained Earnings |
Total | |||||||||||||||||||||
| Common Stock | ||||||||||||||||||||||||
| Shares | Amount | |||||||||||||||||||||||
| Balance, December 31, 2010 |
10,202 | $ | 102 | $ | 25,164 | $ | (65 | ) | $ | 70,164 | $ | 95,365 | ||||||||||||
| Common stock issued on exercise of options |
8 | 0 | 54 | 0 | 0 | 54 | ||||||||||||||||||
| Share based compensation expense, net of tax |
0 | 0 | 473 | 0 | 0 | 473 | ||||||||||||||||||
| Excess tax benefit of stock option exercises |
0 | 0 | 27 | 0 | 0 | 27 | ||||||||||||||||||
| Company repurchase of common stock |
(339 | ) | (3 | ) | (4,775 | ) | 0 | 0 | (4,778 | ) | ||||||||||||||
| Cash dividends on common stock |
0 | 0 | 0 | 0 | (3,835 | ) | (3,835 | ) | ||||||||||||||||
| Unrealized holding gains on marketable securities, net of tax |
0 | 0 | 0 | 31 | 0 | 31 | ||||||||||||||||||
| Net income |
0 | 0 | 0 | 0 | 14,318 | 14,318 | ||||||||||||||||||
|
|
|
|
|
|
|
|
|
|
|
|
|
|||||||||||||
| Balance, December 31, 2011 |
9,871 | $ | 99 | $ | 20,943 | $ | (34 | ) | $ | 80,647 | $ | 101,655 | ||||||||||||
| Common stock issued on exercise of options |
132 | 1 | 1,844 | 0 | 0 | 1,845 | ||||||||||||||||||
| Share based compensation expense, net of tax |
0 | 0 | 695 | 0 | 0 | 695 | ||||||||||||||||||
| Excess tax benefit of stock option exercises |
0 | 0 | 295 | 0 | 0 | 295 | ||||||||||||||||||
| Company repurchase of common stock |
(2,986 | ) | (30 | ) | (22,864 | ) | 0 | (37,338 | ) | (60,232 | ) | |||||||||||||
| Cash dividends on common stock |
0 | 0 | 0 | 0 | (3,550 | ) | (3,550 | ) | ||||||||||||||||
| Unrealized holding gains on marketable securities, net of tax |
0 | 0 | 0 | 57 | 0 | 57 | ||||||||||||||||||
| Net income |
0 | 0 | 0 | 0 | 13,131 | 13,131 | ||||||||||||||||||
|
|
|
|
|
|
|
|
|
|
|
|
|
|||||||||||||
| Balance, December 31, 2012 |
7,017 | $ | 70 | $ | 913 | $ | 23 | $ | 52,890 | $ | 53,896 | |||||||||||||
| Common stock issued on exercise of options and vesting of restricted stock units |
148 | 2 | 1,769 | 0 | 0 | 1,771 | ||||||||||||||||||
| Share based compensation expense, net of tax |
0 | 0 | 1,016 | 0 | 0 | 1,016 | ||||||||||||||||||
| Excess tax benefit of stock option exercises |
0 | 0 | 2,083 | 0 | 0 | 2,083 | ||||||||||||||||||
| Cash dividends on common stock |
0 | 0 | 0 | 0 | (4,056 | ) | (4,056 | ) | ||||||||||||||||
| Unrealized holding losses on marketable securities, net of tax |
0 | 0 | 0 | (49 | ) | 0 | (49 | ) | ||||||||||||||||
| Net income |
0 | 0 | 0 | 0 | 17,892 | 17,892 | ||||||||||||||||||
|
|
|
|
|
|
|
|
|
|
|
|
|
|||||||||||||
| Balance, December 31, 2013 |
7,165 | $ | 72 | $ | 5,781 | $ | (26 | ) | $ | 66,726 | $ | 72,553 | ||||||||||||
|
|
|
|
|
|
|
|
|
|
|
|
|
|||||||||||||
The accompanying notes are an integral part of these financial statements.
F-6
Table of Contents
Barrett Business Services, Inc.
Consolidated Statements of Cash Flows
Years Ended December 31, 2013, 2012 and 2011
(In Thousands)
| 2013 | 2012 | 2011 | ||||||||||
| Cash flows from operating activities: |
||||||||||||
| Net income |
$ | 17,892 | $ | 13,131 | $ | 14,318 | ||||||
| Reconciliations of net income to net cash provided by operating activities: |
||||||||||||
| Depreciation and amortization |
2,037 | 1,477 | 1,344 | |||||||||
| Gains recognized on marketable securities |
(1 | ) | (4 | ) | (52 | ) | ||||||
| Gain recognized on sale and leaseback |
(60 | ) | (122 | ) | (122 | ) | ||||||
| Deferred income taxes |
(632 | ) | 301 | 453 | ||||||||
| Share based compensation |
1,016 | 695 | 473 | |||||||||
| Excess tax benefit from share-based compensation |
(2,083 | ) | (295 | ) | (27 | ) | ||||||
| Changes in certain assets and liabilities: |
||||||||||||
| Trade accounts receivable, net |
(21,665 | ) | (17,401 | ) | (8,924 | ) | ||||||
| Income taxes receivable |
0 | 4,133 | (1,750 | ) | ||||||||
| Prepaid expenses and other |
1,828 | 1,043 | (4,099 | ) | ||||||||
| Accounts payable |
1,257 | 356 | 675 | |||||||||
| Accrued payroll, payroll taxes and related benefits |
22,948 | 17,228 | 14,815 | |||||||||
| Other accrued liabilities |
7 | 6 | (142 | ) | ||||||||
| Income taxes payable |
3,047 | 567 | 0 | |||||||||
| Workers compensation claims liabilities |
41,880 | 20,663 | 12,839 | |||||||||
| Safety incentives liability |
3,244 | 3,521 | 1,297 | |||||||||
| Customer deposits, long-term liabilities and other assets, net |
(519 | ) | 358 | 258 | ||||||||
|
|
|
|
|
|
|
|||||||
| Net cash provided by operating activities |
70,196 | 45,657 | 31,356 | |||||||||
|
|
|
|
|
|
|
|||||||
| Cash flows from investing activities: |
||||||||||||
| Purchase of property and equipment |
(4,097 | ) | (3,712 | ) | (1,247 | ) | ||||||
| Purchase of marketable securities |
(59,917 | ) | (33,539 | ) | (78,013 | ) | ||||||
| Proceeds from sales and maturities of marketable securities |
60,850 | 39,190 | 76,256 | |||||||||
| Purchase of restricted certificates of deposit |
(76,733 | ) | 0 | 0 | ||||||||
| Proceeds from maturities of restricted certificates of deposit |
63,944 | 0 | 0 | |||||||||
| Purchase of restricted marketable securities |
(11,397 | ) | (10,599 | ) | (9,027 | ) | ||||||
| Proceeds from maturities of restricted marketable securities |
9,918 | 10,796 | 7,854 | |||||||||
|
|
|
|
|
|
|
|||||||
| Net cash (used in) provided by investing activities |
(17,432 | ) | 2,136 | (4,177 | ) | |||||||
|
|
|
|
|
|
|
|||||||
| Cash flows from financing activities: |
||||||||||||
| Proceeds from credit-line borrowings |
132,664 | 50,229 | 0 | |||||||||
| Payments on credit-line borrowings |
(137,196 | ) | (45,697 | ) | 0 | |||||||
| Issuance of long-term debt |
0 | 5,512 | 0 | |||||||||
| Payments on long-term debt |
(220 | ) | (19 | ) | 0 | |||||||
| Repurchase of common stock |
0 | (25,432 | ) | (4,778 | ) | |||||||
| Redemption of mandatorily redeemable preferred stock |
0 | (34,800 | ) | 0 | ||||||||
| Dividends paid |
(4,056 | ) | (3,550 | ) | (3,835 | ) | ||||||
| Proceeds from the exercise of stock options and vesting of restricted stock units |
1,771 | 1,845 | 54 | |||||||||
| Excess tax benefit from share-based compensation |
2,083 | 295 | 27 | |||||||||
|
|
|
|
|
|
|
|||||||
| Net cash used in financing activities |
(4,954 | ) | (51,617 | ) | (8,532 | ) | ||||||
|
|
|
|
|
|
|
|||||||
| Net increase (decrease) in cash and cash equivalents |
47,810 | (3,824 | ) | 18,647 | ||||||||
| Cash and cash equivalents, beginning of year |
45,747 | 49,571 | 30,924 | |||||||||
|
|
|
|
|
|
|
|||||||
| Cash and cash equivalents, end of year |
$ | 93,557 | $ | 45,747 | $ | 49,571 | ||||||
|
|
|
|
|
|
|
|||||||
| Supplemental schedule of noncash financing activities: |
||||||||||||
| Issuance of mandatorily redeemable preferred stock |
$ | 0 | $ | 34,800 | $ | 0 | ||||||
|
|
|
|
|
|
|
|||||||
The accompanying notes are an integral part of these financial statements.
F-7
Table of Contents
Barrett Business Services, Inc.
Notes to Consolidated Financial Statements
| 1. | Summary of Operations and Significant Accounting Policies |
Nature of operations
Barrett Business Services, Inc. (BBSI, the Company), is a leading provider of business management solutions for small-and mid-sized companies. The Company has developed a management platform that integrates tools from the human resource outsourcing industry and a knowledge-based approach from the management consulting industry. This platform, through the effective leveraging of human capital, assists our business owner clients in more effectively running their business. We believe this platform, delivered through local teams of professionals, differentiates BBSI from our competitors. The Company operates through a network of branch offices throughout California, Oregon, Washington, Idaho, Arizona, Nevada, Utah, Colorado, Maryland, Delaware and North Carolina. Approximately 74%, 69% and 61%, respectively, of our revenue during 2013, 2012 and 2011 were attributable to our California operations. BBSI was incorporated in Maryland in 1965.
The Company operates a wholly owned captive insurance company, Associated Insurance Company for Excess (AICE). AICE is a fully licensed captive insurance company holding a certificate of authority from the Arizona Department of Insurance. The purpose of AICE is twofold: (1) to provide access to more competitive and cost effective insurance markets and (2) to provide additional flexibility in cost effective risk management. The captive handles the Companys workers compensation claims occurring on or after January 1, 2007. AICE provides excess workers compensation coverage from $1.0 million up to $5.0 million per occurrence in the states of California, Oregon, Delaware and Washington. AICE also provides general liability insurance coverage for BBSI.
The Company also operates a wholly owned insurance company, Ecole Insurance Company (Ecole). Ecole is a fully licensed insurance company holding a certificate of authority from the Arizona Department of Insurance. Ecole provides workers compensation coverage to the Companys employees working in Arizona beginning with claims occurring on or after March 1, 2010. The restricted capital used to capitalize the insurance company was approximately $6.1 million and is included in restricted marketable securities and workers compensation deposits in our consolidated balance sheets.
Principles of consolidation
The accompanying financial statements are prepared on a consolidated basis. All significant intercompany account balances and transactions between BBSI, AICE, Ecole and BBS I, LLC, the aircraft subsidiary which owns an aircraft for managements operational travel needs, have been eliminated in consolidation.
Reportable Segment
The Company has one principal operating and reporting segment. The chief operating decision maker (currently our Chief Executive Officer) regularly reviews the financial information of our business at a consolidated level in deciding how to allocate resources and assessing performance.
F-8
Table of Contents
Barrett Business Services, Inc.
Notes to Consolidated Financial Statements (Continued)
| 1. | Summary of Operations and Significant Accounting Policies (Continued) |
Revenue recognition
We recognize revenue as services are rendered by our workforce. Professional employer (PEO) services are normally used by organizations to satisfy ongoing needs related to the management of human capital and are governed by the terms of a client services agreement with a minimum term of one year, which cover all employees at a particular work site. Our client services agreements are renewable on an annual basis and typically require 30 days written notice to cancel or terminate the contract by either party. Our client services agreements provide for immediate termination upon any default of the client regardless of when notice is given. We report PEO revenues on a net basis because we are not the primary obligor for the services provided by our clients to their customers pursuant to our client services agreements. Consequently, these service fee revenues represent the gross margin generated from our professional employer services after deducting the amounts invoiced to our clients for direct payroll expenses such as salaries, wages, health insurance and employee out-of-pocket expenses incurred incidental to employment and safety incentives. These amounts are also excluded from cost of revenues. Professional Employer service fees also include amounts invoiced to our clients for employer payroll-related taxes and workers compensation coverage. Staffing services are engaged by customers to meet short-term and long-term personnel needs.
Cost of revenues
Our cost of revenues for PEO services includes employer payroll related taxes and workers compensation. Our cost of revenues for staffing services is comprised of direct payroll costs, employer payroll related taxes and employee benefits and workers compensation. Direct payroll costs represent the gross payroll earned by staffing services employees based on salary or hourly wages. Payroll taxes and employee benefits consist of the employers portion of Social Security and Medicare taxes, federal and state unemployment taxes and staffing services employee reimbursements for materials, supplies and other expenses, which are paid by our customer. Workers compensation costs consist primarily of the costs associated with our self-insured workers compensation program, such as claims reserves, claims administration fees, legal fees, state administrative agency fees and excess insurance premiums for catastrophic injuries.
We also maintain separate workers compensation insurance policies for employees working in states where the Company is not self-insured. Safety incentives represent cash incentives paid to certain client companies engaged in a client services agreement, for maintaining safe-work practices in order to minimize workplace injuries. The incentive is based on a percentage of annual payroll and is paid annually to clients who meet predetermined workers compensation claims cost objectives.
F-9
Table of Contents
Barrett Business Services, Inc.
Notes to Consolidated Financial Statements (Continued)
| 1. | Summary of Operations and Significant Accounting Policies (Continued) |
Cash and cash equivalents
We consider non-restricted short-term investments, which are highly liquid, readily convertible into cash, and have original maturities of less than three months, to be cash equivalents for purposes of the statements of cash flows. A substantial portion of the Companys cash and cash equivalents is invested in tax-exempt money market funds managed by the Companys principal bank. The Company maintains cash balances in bank accounts that normally exceed FDIC insured limits. As of December 31, 2013, cash and cash equivalents exceeded federally insured limits by approximately $92.6 million. The Company has not experienced any losses related to its cash concentration.
Marketable securities
As of December 31, 2013, the Companys marketable securities consisted of tax-exempt municipal securities, U.S. Treasuries, variable rate demand notes (VRDN) and corporate bonds. We determine the appropriate classification for certain investments in debt securities, and classify our marketable securities as trading or available-for-sale. The Company classifies municipal securities, U.S. Treasuries, VRDN, and corporate bonds as available for sale; they are reported at fair value with unrealized gains and losses, net of taxes, shown as a component of accumulated other comprehensive income (loss) in stockholders equity. Management considers available evidence in evaluating potential impairment of investments, including the duration and extent to which fair value is less than cost and the Companys ability and intent to hold the investments. In the event a loss is determined to be other-than-temporary, the loss will be recognized in the consolidated statement of operations.
Restricted marketable securities
At December 31, 2013 and 2012, restricted marketable securities consisted of U.S. Treasuries, municipal debt instruments, and corporate debt instruments with maturities generally from 180 days to two years (see Note 3, Note 4 and Note 6). At December 31, 2013 and 2012, the approximate fair value of restricted marketable securities equaled their approximate amortized cost. Restricted marketable securities have been categorized as available-for-sale; they are reported at fair value with unrealized gains and losses, net of taxes, shown as a component of accumulated other comprehensive income (loss) in stockholders equity. Realized gains and losses on sales of restricted marketable securities are included in other income (expense) on our consolidated statements of operations.
Allowance for doubtful accounts
We must make estimates of the collectability of our accounts receivable for services provided to our customers. Our management analyzes historical bad debts, customer concentrations, customer credit-worthiness, current economic conditions and changes in customers payment trends when evaluating the adequacy of the allowance for doubtful accounts. If the financial condition of our customers deteriorates, resulting in an impairment of their ability to make payments, additional allowances may be required.
F-10
Table of Contents
Barrett Business Services, Inc.
Notes to Consolidated Financial Statements (Continued)
| 1. | Summary of Operations and Significant Accounting Policies (Continued) |
Our allowance for doubtful accounts activity is summarized as follows (in thousands):
| 2013 | 2012 | 2011 | ||||||||||
| Balance at January 1, |
||||||||||||
| Allowance for doubtful accounts |
$ | 381 | $ | 452 | $ | 374 | ||||||
| Charges to expense |
300 | 195 | 100 | |||||||||
| Write-offs of uncollectible accounts, net of recoveries |
(439 | ) | (266 | ) | (22 | ) | ||||||
| Balance at December 31, |
||||||||||||
|
|
|
|
|
|
|
|||||||
| Allowance for doubtful accounts |
$ | 242 | $ | 381 | $ | 452 | ||||||
|
|
|
|
|
|
|
|||||||
Income taxes
Our income taxes are accounted for using an asset and liability approach. This requires the recognition of deferred tax assets and liabilities for the expected future tax consequences of temporary differences between the financial statement and tax basis of assets and liabilities at the applicable tax rates. A valuation allowance is recorded against deferred tax assets if, based on the weight of the available evidence, it is more likely than not that some or all of the deferred tax assets will not be realized. The factors used to assess the likelihood of realization include the Companys forecast of the reversal of temporary differences, future taxable income and available tax planning strategies that could be implemented to realize the net deferred tax assets. Failure to achieve forecasted taxable income in applicable tax jurisdictions could affect the ultimate realization of deferred tax assets and could result in an increase in the Companys effective tax rate on future earnings.
The determination of our provision for income taxes requires significant judgment, the use of estimates, and the interpretation and application of complex tax laws. Significant judgment is required in assessing the timing and amounts of deductible and taxable items and the probability of sustaining uncertain tax positions. The Company recognizes the tax benefit from uncertain tax positions if it is more likely than not that the tax positions will be sustained on examination by the tax authorities, based on the technical merits of the position. The tax benefit is measured based on the largest benefit that has a greater than 50% likelihood of being realized upon ultimate settlement. As facts and circumstances change, we reassess these probabilities and would record any changes in the consolidated financial statements as appropriate. The Company recognizes interest and penalties related to unrecognized tax benefits in income tax expense.
Business combinations
We account for business combinations using the acquisition method of accounting. Expenses incurred in connection with a business combination are expensed as incurred. Changes in deferred tax asset valuation allowances and acquired income tax uncertainties after the measurement period are recognized in earnings.
F-11
Table of Contents
Barrett Business Services, Inc.
Notes to Consolidated Financial Statements (Continued)
| 1. | Summary of Operations and Significant Accounting Policies (Continued) |
Goodwill and intangible assets
Goodwill is recorded as the difference, if any, between the aggregate consideration paid for a business combination and the fair value of the net assets acquired. Goodwill is not amortized but is evaluated for impairment annually or more frequently if indicators of impairment are present or changes in circumstances suggest that impairment may exist. The Company has one reporting unit and evaluates the carrying value of goodwill annually at December 31. No impairment has been recognized in the periods presented.
Our intangible assets with definite lives are amortized on a straight-line basis over their estimated economic useful lives.
Property, equipment and software
Property, equipment and software are stated at cost. Expenditures for maintenance and repairs are charged to operating expense as incurred and expenditures for additions and improvements are capitalized. The cost of assets sold or otherwise disposed of and the related accumulated depreciation are eliminated from the accounts, and any resulting gain or loss is reflected in the consolidated statements of operations.
Depreciation of property, equipment and software is calculated using either straight-line or accelerated methods over estimated useful lives of the related assets or lease terms, as follows:
| Years | ||
| Buildings |
39 | |
| Office furniture and fixtures |
7 | |
| Computer hardware and software |
3-10 | |
| Aircraft |
20 | |
| Leasehold improvements |
Life of lease |
Impairment of long-lived assets
Long-lived assets, such as property, equipment and software and acquired intangibles, subject to amortization, are reviewed for impairment annually, or whenever events or changes in circumstances indicate that the remaining estimated useful life may warrant revision or that the carrying amount of an asset may not be recoverable. Some of the events or changes in circumstances that would trigger an impairment review include, but are not limited to, significant under-performance relative to expected and/or historical results (such as two years of significant sales declines or two years of significant negative operating cash flows), significant negative industry or economic trends, or knowledge of transactions involving the sale of similar property at amounts below the carrying value.
Assets are grouped for recognition and measurement of impairment at the lowest level for which identifiable cash flows are largely independent of the cash flows of other
F-12
Table of Contents
Barrett Business Services, Inc.
Notes to Consolidated Financial Statements (Continued)
| 1. | Summary of Operations and Significant Accounting Policies (Continued) |
assets. If the carrying amount of an asset group exceeds the estimated, undiscounted future cash flows expected to be generated by the asset, then an impairment charge is recognized to the extent the carrying amount exceeds the assets fair value. In determining fair value, management considers current results, trends, future prospects, and other economic factors.
Workers compensation claims liabilities
The estimated liability for unsettled workers compensation claims represents our best estimate, which includes an evaluation of information provided by our internal claims adjusters and our third-party administrators for workers compensation claims, coupled with an actuarial estimate of future cost development of reported claims and incurred but not reported claims (together, IBNR) provided by the Companys independent actuary. Included in the claims liabilities are case reserve estimates for reported losses, plus additional amounts for estimated future development of reported claims and incurred but not reported claims as well as estimates for unallocated loss adjustment expenses, including legal costs. These estimates are continually reviewed and adjustments to liabilities are reflected in current operating results as they become known.
Safety incentives liability
Safety incentives represent cash incentives paid to certain PEO client companies for maintaining safe-work practices in order to minimize workplace injuries. The incentive is based on a percentage of annual payroll and is paid annually to customers who meet predetermined workers compensation claims cost objectives. Safety incentive payments are made only after closure of all workers compensation claims incurred during the customers contract period. The liability is estimated and accrued each month based upon contract year-to-date payroll and the then-current amount of the customers estimated workers compensation claims reserves as established by us and our third party administrator and the expected payout as determined by historical incentive payment trends. Safety incentive expense is netted against PEO services revenue in our consolidated statements of operations.
Customer deposits
We require deposits from certain PEO customers to cover a portion of our accounts receivable due from such customers in the event of default of payment.
Comprehensive income (loss)
Comprehensive income (loss) includes all changes in equity during a period except those that resulted from investments by or distributions to the Companys stockholders.
Other comprehensive income (loss) refers to revenues, expenses, gains and losses that under generally accepted accounting principles are included in comprehensive income (loss), but excluded from net income (loss) as these amounts are recorded directly as an adjustment to stockholders equity. Our other comprehensive income (loss) is comprised of unrealized holding gains and losses on our available for sale marketable securities.
F-13
Table of Contents
Barrett Business Services, Inc.
Notes to Consolidated Financial Statements (Continued)
| 1. | Summary of Operations and Significant Accounting Policies (Continued) |
Statements of cash flows
Interest paid during 2013, 2012 and 2011 did not materially differ from interest expense. Income taxes paid by the Company in 2013, 2012 and 2011 totaled $9.0 million, $3.3 million and $4.7 million, respectively.
Basic and diluted earnings per share
Basic earnings per share are computed based on the weighted average number of common shares outstanding for each year using the treasury method. Diluted earnings per share reflect the potential effects of the exercise of outstanding stock options. Basic and diluted shares outstanding are summarized as follows (in thousands):
| Year Ended December 31, |
||||||||||||
| 2013 | 2012 | 2011 | ||||||||||
| Weighted average number of basic shares outstanding |
7,105 | 7,723 | 10,082 | |||||||||
| Effect of dilutive securities |
292 | 140 | 68 | |||||||||
|
|
|
|
|
|
|
|||||||
| Weighted average number of diluted shares outstanding |
7,397 | 7,863 | 10,150 | |||||||||
|
|
|
|
|
|
|
|||||||
Reclassifications
Certain prior year amounts have been reclassified to conform to the 2013 presentation. Such reclassifications had no impact on the Companys financial condition, operating results, cash flows, working capital or stockholders equity.
Accounting estimates
The preparation of our consolidated financial statements in conformity with accounting principles generally accepted in the United States of America requires management to make estimates and assumptions that affect the reported amounts of assets and liabilities and disclosure of contingent assets and liabilities at the date of the consolidated financial statements and the reported amounts of revenues and expenses during the reporting periods. Management bases its estimates on historical experience and on various other assumptions that are believed to be reasonable under the circumstances, the results of which form the basis for making judgments about the carrying values of assets and liabilities that are not readily apparent from other sources. Estimates are used for carrying values of marketable securities, allowance for doubtful accounts, deferred income taxes, carrying values for goodwill and property and equipment, accrued workers compensation liabilities and safety incentive liabilities. Actual results may or may not differ from such estimates.
Recent Accounting Pronouncements
In July 2013, the Financial Accounting Standards Board (FASB) issued ASU 2013-11, Income Taxes (Topic 740): Presentation of Unrecognized Tax Benefit When a Net Operating Loss Carryforward, A Similar Tax Loss, or a Tax Credit Carryforward Exists (A
F-14
Table of Contents
Barrett Business Services, Inc.
Notes to Consolidated Financial Statements (Continued)
| 1. | Summary of Operations and Significant Accounting Policies (Continued) |
Consensus the FASB Emerging Issues Task Force). Accounting Standards update ASU 2013-11 provides guidance on financial statement presentation of unrecognized tax benefit when a net operating loss carryforward, a similar tax loss, or a tax credit carryforward exists. The FASBs objective in issuing this ASU is to eliminate diversity in practice resulting from a lack of guidance on this topic in current U.S. GAAP. This ASU applies to all entities with unrecognized tax benefits that also have tax loss or tax credit carryforwards in the same tax jurisdiction as of the reporting date. This amendment is effective for public entities for fiscal years beginning after December 15, 2013 and interim periods within those years. The Company does not expect the adoption of this standard to have a material impact on the Companys financial statements.
Management believes that accounting pronouncements with a material impact on our consolidated financial statements have been implemented and do not believe there are any new or pending pronouncements that will materially impact our consolidated financial position or results of operations.
| 2. | Stock Repurchase |
Effective March 28, 2012, the Company repurchased 2,485,929 shares of the Companys common stock held by the Estate of William W. Sherertz and 500,000 common shares held by Nancy Sherertz. Mr. Sherertz, a founder and former president and CEO of the Company, died January 20, 2011. Nancy Sherertz is also a founder of the Company. The common shares were repurchased at a price of $20 per share, representing total consideration of $59.7 million. The Company used a combination of $24.9 million in cash and issued 34,800 shares of Series A Nonconvertible, Non-Voting Redeemable Preferred Stock with a liquidation preference of $1,000 per share. Additionally, the Company incurred professional and legal fees totaling $514,000 related to the transaction.
Effective September 21, 2012, the Company redeemed all of the outstanding shares of its Series A Nonconvertible, Non-Voting Redeemable Preferred Stock for $34.8 million using a combination of cash on hand and availability under a new revolving credit facility provided by its principal bank. By redeeming the preferred stock within six months of issuance, the Company avoided having to pay a 5% semi-annual dividend of approximately $870,000 due September 28, 2012.
| 3. | Fair Value of Financial Instruments and Concentration of Credit Risk |
All of our financial instruments are recognized in our consolidated balance sheet. Carrying values approximate fair value of most financial assets and liabilities. The fair value of restricted marketable securities consisting primarily of U.S. Treasury bills and municipal bonds is recorded at amortized cost, which approximates market value for similar instruments. The interest rates on our restricted marketable security investments approximate current market rates for these types of investments; therefore, the recorded value of the restricted marketable securities approximates fair value.
F-15
Table of Contents
Barrett Business Services, Inc.
Notes to Consolidated Financial Statements (Continued)
| 3. | Fair Value of Financial Instruments and Concentration of Credit Risk (Continued) |
Financial instruments that potentially subject us to concentration of credit risk consist primarily of temporary cash investments, marketable securities, restricted marketable securities and trade accounts receivable. We restrict investment of temporary cash investments and marketable securities to financial institutions with high credit ratings, corporate bonds and to investments in governmental debt instruments. Credit risk on trade receivables is minimized as a result of the large and diverse nature of our customer base.
At December 31, 2013, we had significant concentrations of credit risk as follows:
| - | Cash and cash equivalents approximately $66.3 million of the Companys cash and cash equivalents at December 31, 2013 were invested in tax-exempt money market funds. Fair value was determined using quoted prices in active markets for identical securities. |
| - | Marketable securities$10.0 million, at fair value, in VRDN. |
| - | Marketable securities$8.8 million, at fair value, in municipal bonds. |
| 4. | Fair Value Measurement |
Fair value is the price that would be received to sell an asset or paid to transfer a liability in an orderly transaction between market participants at the measurement date.
Factors used in determining the fair value of our financial assets and liabilities are summarized into three broad categories:
| | Level 1quoted prices in active markets for identical securities; |
| | Level 2other significant observable inputs, including quoted prices for similar securities, interest rates, prepayment speeds, credit risk, etc.; and |
| | Level 3significant unobservable inputs, including our own assumptions in determining fair value. |
The inputs or methodology used for valuing securities are not necessarily an indication of the risk associated with investing in those securities.
In determining the fair value of our financial assets, the Company predominately uses the market approach. In determining the fair value of all its municipal bonds, corporate bonds, and variable rate demand notes classified as Level 2, the Company utilizes the non-binding quotes provided by our three investment brokers. We receive one non-binding broker quote for each financial asset as of the balance sheet date. To value the Level 2 assets, our investment brokers use proprietary multi-dimensional pricing models that include a variety of inputs, including quoted prices for identical or similar assets in
F-16
Table of Contents
Barrett Business Services, Inc.
Notes to Consolidated Financial Statements (Continued)
| 4. | Fair Value Measurement (Continued) |
active markets, quoted prices for identical or similar assets in markets that are not active, interest rates and yield curves observable at commonly quoted intervals, volatilities, prepayment speeds, loss severities, credit risks and default rates that are observable at commonly quoted intervals. There were no assets or liabilities where Level 3 valuation techniques were used and there were no assets and liabilities measured at fair value on a non-recurring basis.
Marketable securities consist of the following (in thousands):
| December 31, 2013 | December 31, 2012 | |||||||||||||||||||||||||||
| Cost | Gross Unrealized (Losses) |
Recorded Basis |
Cost |
Gross Unrealized Gains |
Recorded Basis |
Fair Value Category |
||||||||||||||||||||||
| Current: |
||||||||||||||||||||||||||||
| Available-for-sale: |
||||||||||||||||||||||||||||
| Municipal bonds |
$ | 0 | $ | 0 | $ | 0 | $ | 409 | $ | 1 | $ | 410 | 2 | |||||||||||||||
| VRDN |
10,000 | 0 | 10,000 | 0 | 0 | 0 | 2 | |||||||||||||||||||||
| Corporate bonds |
9,800 | (13 | ) | 9,787 | 14,764 | 16 | 14,780 | 2 | ||||||||||||||||||||
| U.S. Treasuries |
0 | 0 | 0 | 1,555 | 3 | 1,558 | 1 | |||||||||||||||||||||
|
|
|
|
|
|
|
|
|
|
|
|
|
|||||||||||||||||
| $ | 19,800 | $ | (13 | ) | $ | 19,787 | $ | 16,728 | $ | 20 | $ | 16,748 | ||||||||||||||||
|
|
|
|
|
|
|
|
|
|
|
|
|
|||||||||||||||||
| Long term: |
||||||||||||||||||||||||||||
| Available-for-sale: |
||||||||||||||||||||||||||||
| Municipal bonds |
$ | 4,074 | $ | (17 | ) | $ | 4,057 | $ | 292 | $ | 1 | $ | 293 | 2 | ||||||||||||||
| Corporate bonds |
1,879 | (27 | ) | 1,852 | 9,111 | 28 | 9,139 | 2 | ||||||||||||||||||||
| Held-to-maturity: |
||||||||||||||||||||||||||||
| Corporate bonds |
0 | 0 | 0 | 467 | 0 | 467 | 2 | |||||||||||||||||||||
|
|
|
|
|
|
|
|
|
|
|
|
|
|||||||||||||||||
| $ | 5,953 | $ | (44 | ) | $ | 5,909 | $ | 9,870 | $ | 29 | $ | 9,899 | ||||||||||||||||
|
|
|
|
|
|
|
|
|
|
|
|
|
|||||||||||||||||
The Companys restricted marketable securities component of restricted marketable securities and workers compensation deposits consists of the following (in thousands):
| December 31, 2013 | December 31, 2012 | |||||||||||||||||||||||||||
| Cost | Gross Unrealized Gains |
Recorded Basis |
Cost | Gross Unrealized Gains |
Recorded Basis |
Fair Value Category |
||||||||||||||||||||||
| Available-for-sale: |
||||||||||||||||||||||||||||
| Municipal bonds |
$ | 4,742 | $ | 10 | $ | 4,752 | $ | 4,920 | $ | 17 | $ | 4,937 | 2 | |||||||||||||||
| Corporate bonds |
2,849 | 5 | 2,854 | 2,035 | 5 | 2,040 | 2 | |||||||||||||||||||||
| U.S. treasuries |
2,787 | 0 | 2,787 | 1,780 | 0 | 1,780 | 1 | |||||||||||||||||||||
|
|
|
|
|
|
|
|
|
|
|
|
|
|||||||||||||||||
| $ | 10,378 | $ | 15 | $ | 10,393 | $ | 8,735 | $ | 22 | $ | 8,757 | |||||||||||||||||
|
|
|
|
|
|
|
|
|
|
|
|
|
|||||||||||||||||
F-17
Table of Contents
Barrett Business Services, Inc.
Notes to Consolidated Financial Statements (Continued)
| 4. | Fair Value Measurement (Continued) |
The Companys long term restricted certificates of deposit are summarized as follows (in thousands):
| December 31, 2013 | December 31, 2012 | |||||||||||||||||||||||||||
| Cost | Gross Unrealized Gains |
Recorded Basis |
Cost | Gross Unrealized Gains |
Recorded Basis |
Fair Value Category |
||||||||||||||||||||||
| Restricted certificates of deposit |
$ | 12,789 | $ | 0 | $ | 12,789 | $ | 0 | $ | 0 | $ | 0 | 2 | |||||||||||||||
| 5. | Property, Equipment and Software |
Property, equipment and software consist of the following (in thousands):
| December 31, | ||||||||
| 2013 | 2012 | |||||||
| Buildings |
$ | 11,158 | $ | 10,897 | ||||
| Office furniture and fixtures |
8,912 | 6,095 | ||||||
| Computer hardware and software |
8,032 | 7,098 | ||||||
| Aircraft |
4,617 | 4,584 | ||||||
|
|
|
|
|
|||||
| 32,719 | 28,674 | |||||||
| Less accumulated depreciation and amortization |
13,660 | 11,675 | ||||||
|
|
|
|
|
|||||
| 19,059 | 16,999 | |||||||
| Land |
1,490 | 1,490 | ||||||
|
|
|
|
|
|||||
| $ | 20,549 | $ | 18,489 | |||||
|
|
|
|
|
|||||
| 6. | Workers Compensation Claims |
We are a self-insured employer with respect to workers compensation coverage for all our employees (including employees subject to PEO contracts) working in California, Oregon, Maryland, Delaware and Colorado. In the state of Washington, state law allows only our staffing services and management employees to be covered under the Companys self-insured workers compensation program.
The Company also operates Ecole, a wholly owned fully licensed insurance company in Arizona. The insurance company provides workers compensation coverage to BBSIs employees working in Arizona for claims occurring on or after March 1, 2010.
The Company has provided a total of $112.4 million and $70.6 million at December 31, 2013 and 2012, respectively, as an estimated future liability for unsettled workers compensation claims liabilities. Included in the foregoing liabilities are insured claims that will be paid by the Companys former excess workers compensation insurer and for which the Company has reported a receivable from the insurer for the insured claims
F-18
Table of Contents
Barrett Business Services, Inc.
Notes to Consolidated Financial Statements (Continued)
| 6. | Workers Compensation Claims (Continued) |
liability. Insured claims totaled $768,000 and $757,000 at December 31, 2013 and 2012, respectively. The estimated liability for unsettled workers compensation claims represents managements best estimate based upon an actuarial valuation provided by an independent actuary. Included in the claims liabilities are case reserve estimates for reported losses, plus additional amounts based on projections for incurred but not reported claims and anticipated increases in case reserve estimates. These estimates also include amounts for unallocated loss adjustment expenses, including legal costs. These estimates are continually reviewed and adjustments to liabilities are reflected in current operating results as they become known.
Liabilities incurred for work-related employee fatalities and for severely injured workers, as determined by the state in which the accident occurred, are recorded either at an agreed lump-sum settlement amount or the net present value of future fixed and determinable payments over the actuarially determined remaining life expectancy of the beneficiary, discounted at a rate that approximates a long-term, high-quality corporate bond rate. Our excess workers compensation insurance retention is $5.0 million per occurrence in all our self-insured states, except for Colorado and Maryland where our retention is at $2.0 million and $1.0 million per occurrence, respectively. We present our accrued liabilities for workers compensation claims on a gross basis along with a corresponding receivable from our insurers, as we are the primary obligor for payment of the related insured claims. We maintain excess workers compensation insurance coverage with ACE Group (ACE), between $5.0 million and $15.0 million per occurrence, except in Maryland, where coverage with ACE is between $1.0 million and $25.0 million per occurrence and in Colorado where the coverage with ACE is from $2.0 million to statutory limits per occurrence. Prior to December 1, 2012, similar excess workers compensation coverage was through American International Group.
We continue to evaluate the financial capacity of our insurers to assess the recoverability of the related insurer receivables.
At December 31, 2013, our long-term workers compensation claims liabilities in the accompanying consolidated balance sheet included $331,000 for work-related fatalities. The aggregate undiscounted payout amount related to the catastrophic injuries and fatalities is $440,000. The discount rates applied to the discounted liabilities range from 4.25% to 9.00%. These rates represented the then-current rates for high quality long-term debt securities available at the date of loss with maturities equal to the length of the payout period to the beneficiaries. The actuarially determined payout periods to the beneficiaries range from 7 to 32 years.
The states of California, Oregon, Maryland, Washington, Delaware and Colorado require us to maintain specified investment balances or other financial instruments, totaling $72.9 million at December 31, 2013 and $26.1 million at December 31, 2012, to cover potential claims losses. In partial satisfaction of these requirements, at December 31, 2013, we have provided surety bonds and standby letters of credit totaling $70.8 million. The
F-19
Table of Contents
Barrett Business Services, Inc.
Notes to Consolidated Financial Statements (Continued)
| 6. | Workers Compensation Claims (Continued) |
investments are included in restricted marketable securities and workers compensation deposits in the accompanying consolidated balance sheets. Prior to July 1, 2012, we participated in Californias alternative security program requiring us to pay the State an annual fee, which was determined by several factors, including the amount of a calculated future security deposit and our overall credit rating. The annual fee paid to the State of California for 2011 was $292,000. Effective June 1, 2013, the State of California increased the Companys surety deposit requirement to $63.9 million (which is included in the total $70.8 million of surety bonds and standby letters or credit), which the Company satisfied through the posting of third party issued surety bonds which are backed by a $12.8 million letter of credit. In conjunction with this letter of credit, the Company posted $12.8 million of certificates of deposit with Wells Fargo as collateral and is included in long-term assets on the consolidated balance sheet.
The following table summarizes the aggregate workers compensation reserve activity (in thousands):
| Year Ended December 31, | ||||||||||||
| 2013 | 2012 | 2011 | ||||||||||
| Balance at January 1, |
||||||||||||
| Workers compensation claims liabilities |
$ | 70,564 | $ | 51,193 | $ | 39,302 | ||||||
| Claims expense accrual: |
||||||||||||
| Current year |
63,822 | 38,386 | 26,161 | |||||||||
| Prior years |
23,445 | 12,344 | 9,978 | |||||||||
|
|
|
|
|
|
|
|||||||
| 87,267 | 50,730 | 36,139 | ||||||||||
|
|
|
|
|
|
|
|||||||
| Claims payments related to: |
||||||||||||
| Current year |
10,586 | 6,746 | 5,565 | |||||||||
| Prior years |
34,801 | 24,613 | 18,683 | |||||||||
|
|
|
|
|
|
|
|||||||
| 45,387 | 31,359 | 24,248 | ||||||||||
|
|
|
|
|
|
|
|||||||
| Balance at December 31, |
||||||||||||
| Workers compensation claims liabilities |
$ | 112,444 | $ | 70,564 | $ | 51,193 | ||||||
|
|
|
|
|
|
|
|||||||
| Incurred but not reported (IBNR) |
$ | 69,611 | $ | 47,992 | $ | 37,335 | ||||||
|
|
|
|
|
|
|
|||||||
| 7. | Revolving Credit Facility and Long-Term Debt |
The Company maintains a credit agreement (the Agreement) with its principal bank, Wells Fargo Bank, National Association (the Bank). The Agreement, which expires October 1, 2017, provides for a revolving credit facility with a current borrowing capacity of up to $19.0 million. The Company had no outstanding borrowings on its revolving credit line at December 31, 2013. At December 31, 2012, the Company had $4.5 million outstanding on its revolving credit line. The Agreement also provides for the continuance of existing standby letters of credit in connection with various surety deposit requirements for workers compensation purposes, as to which the amount outstanding totaled approximately $19.4 million at December 31, 2013.
F-20
Table of Contents
Barrett Business Services, Inc.
Notes to Consolidated Financial Statements (Continued)
| 7. | Revolving Credit Facility and Long-Term Debt (Continued) |
Advances under the revolving credit facility bear interest, at the Companys option, at either (a) a fixed rate for a term selected by the Company from time-to-time or (b) a fluctuating rate. In each case, the rate is calculated based on LIBOR plus 1.75%. The Agreement also provides for an unused commitment fee of 0.25% per annum on the average daily-unused amount of the revolving credit facility.
The credit facility is collateralized by the Companys accounts receivable and other rights to receive payment, general intangibles and equipment. Under the Agreement, the maximum principal amount available is reduced by $2.5 million every six months commencing April 1, 2013.
The Agreement, as amended, requires the satisfaction of certain financial covenants as follows:
| | minimum Fixed Charge Coverage ratio of no less than 1.25:1.0, measured quarterly on a rolling four-quarter basis; |
| | funded Debt: EBITDA of no more than 1.75:1 through September 30, 2014; 1.5:1 through September 30, 2015; and 1.25:1 thereafter, measured quarterly on a rolling four-quarter basis; |
| | ratio of restricted and unrestricted cash and marketable securities to workers compensation and safety incentive liabilities of at least 1.0:1.0, measured quarterly; and |
| | prohibition on incurring additional indebtedness without the prior approval of the Bank, other than up to $200,000 per year in purchase money financing. |
The Agreement also contains customary events of default. If an event of default under the Agreement occurs and is continuing, the Bank may declare any outstanding obligations under the Agreement to be immediately due and payable. The Company was in compliance with all applicable financial covenants at December 31, 2013.
Additionally, the Company maintains a term loan with the Bank for approximately $5.3 million secured by the Companys corporate office building in Vancouver, Washington. The term loan requires payment of monthly installments of $18,375, bearing interest at the one month LIBOR plus 2.25%, with the unpaid principal balance due November 1, 2017.
| 8. | 401(k) Savings Plan |
We have a Section 401(k) Retirement Savings Plan for the benefit of our eligible employees. All staffing and management employees 21 years of age or older become eligible to participate in the savings plan upon completion of 1,000 hours of service in any consecutive 12-month period following the initial date of employment. Employees
F-21
Table of Contents
Barrett Business Services, Inc.
Notes to Consolidated Financial Statements (Continued)
| 8. | 401(k) Savings Plan (Continued) |
covered under a PEO arrangement may participate in the plan at the sole discretion of the PEO client. The determination of discretionary Company contributions to the plan, if any, is at the sole discretion of our Board of Directors. No discretionary Company contributions were made to the plan for the years ended December 31, 2013, 2012 and 2011.
We make matching contributions to the 401(k) plan under a safe harbor provision, whereby the Company matches 100% of contributions by management and staffing employees up to 3% of each participating employees annual compensation; and 50% of the employees contributions up to an additional 2% of annual compensation. We made $734,000, $610,000 and $494,000 in matching contributions during 2013, 2012 and 2011, respectively. Participants interests in Company safe harbor contributions to the plan are fully vested when made.
| 9. | Commitments and Contingencies |
Lease commitments
We lease office space for our branch offices under operating lease agreements that require minimum annual payments as follows (in thousands):
| Year ending December 31, |
||||
| 2014 |
$ | 2,941 | ||
| 2015 |
2,490 | |||
| 2016 |
1,960 | |||
| 2017 |
1,333 | |||
| 2018 |
371 | |||
| Thereafter |
13 | |||
|
|
|
|||
| $ | 9,108 | |||
|
|
|
|||
Rent expense was approximately $3.2 million, $2.8 million, and $2.9 million for the years ended December 31, 2013, 2012 and 2011, respectively.
Contingency
During September 2012, California Senate Bill 863 (SB 863), designed to reform Californias workers compensation system, was signed into law. Section 3701.9 of Section 16 of SB 863 was added to the Labor Code and includes a provision whereby the California Director of Self-Insurance is required not to issue certificates of consent to self-insure after January 1, 2013 to any employer engaged in the activities of a professional employer organization, a leasing employer, a temporary services employer or any employer the Director determines to be in the business of providing employees to other employers. Additionally, a certificate of consent to self-insure that previously had been issued to any employer engaged in these types of activities is required to be revoked by
F-22
Table of Contents
Barrett Business Services, Inc.
Notes to Consolidated Financial Statements (Continued)
| 9. | Commitments and Contingencies (Continued) |
the Director not later than January 1, 2015. If the Company, which has a certificate of consent to self-insure in place, is not able to secure alternatives to address the impact of SB 863 on the Companys ability to continue its self-insurance program in California, our results of operations may be adversely affected.
| 10. | Related Party Transactions |
During 2009, pursuant to the approval of all disinterested outside directors, the Company purchased 1.25 acres of river front property on the Columbia River in Washougal, Washington for a total cost of $1.5 million. The purchase was financed with cash of $1.0 million and a note payable of $500,000. The note payable was paid in full during 2013. Prior to his death on January 20, 2011, William W. Sherertz, previously the Companys Chief Executive Officer, had planned to construct and operate a restaurant on the property under a triple net ground lease between the Company and the LLC he had formed with an outside third party. Mr. Sherertzs estate now holds a majority interest in the LLC. The lease requires annual cash payments by the LLC of $25,000 through the end of 2011 and 5% of the restaurants gross income, if any, thereafter through the end of the lease in December 2020. The cost of the property is included in the Companys other assets at December 31, 2013 and 2012.
| 11. | Income Taxes |
The provision for income taxes from continuing operations are as follows (in thousands):
| Year ended December 31, | ||||||||||||
| 2013 | 2012 | 2011 | ||||||||||
| Current: |
||||||||||||
| Federal |
$ | 6,386 | $ | 5,378 | $ | 857 | ||||||
| State |
1,225 | 685 | (474 | ) | ||||||||
|
|
|
|
|
|
|
|||||||
| 7,611 | 6,063 | 383 | ||||||||||
|
|
|
|
|
|
|
|||||||
| Deferred: |
||||||||||||
| Federal |
(519 | ) | 341 | 283 | ||||||||
| State |
(82 | ) | (76 | ) | 171 | |||||||
|
|
|
|
|
|
|
|||||||
| (601 | ) | 265 | 454 | |||||||||
|
|
|
|
|
|
|
|||||||
| Total provision |
$ | 7,010 | $ | 6,328 | $ | 837 | ||||||
|
|
|
|
|
|
|
|||||||
F-23
Table of Contents
Barrett Business Services, Inc.
Notes to Consolidated Financial Statements (Continued)
| 11. | Income Taxes (Continued) |
Deferred income tax assets and liabilities are comprised of the following components (in thousands):
| December 31, | ||||||||
| 2013 | 2012 | |||||||
| Gross deferred income tax assets: |
||||||||
| Workers compensation claims liabilities |
$ | 6,985 | $ | 4,833 | ||||
| Safety incentives payable |
3,529 | 3,422 | ||||||
| Allowance for doubtful accounts |
94 | 148 | ||||||
| Deferred compensation |
0 | 44 | ||||||
| Tax effect of unrealized losses, net |
959 | 936 | ||||||
| Alternative minimum tax credit carryforward |
0 | 0 | ||||||
| State credit carryforward |
805 | 805 | ||||||
| State loss carryforward |
0 | 0 | ||||||
| Other |
504 | 284 | ||||||
|
|
|
|
|
|||||
| 12,876 | 10,472 | |||||||
| Less valuation allowance |
1,763 | 1,773 | ||||||
|
|
|
|
|
|||||
| 11,113 | 8,699 | |||||||
|
|
|
|
|
|||||
| Gross deferred income tax liabilities: |
||||||||
| Tax depreciation in excess of book depreciation |
(2,793 | ) | (2,017 | ) | ||||
| Tax amortization of goodwill |
(10,178 | ) | (9,141 | ) | ||||
|
|
|
|
|
|||||
| (12,971 | ) | (11,158 | ) | |||||
|
|
|
|
|
|||||
| Net deferred income tax liabilities |
$ | (1,858 | ) | $ | (2,459 | ) | ||
|
|
|
|
|
|||||
The effective tax rate for continuing operations differed from the U.S. statutory federal tax rate due to the following:
| Year ended December 31, | ||||||||||||
| 2013 | 2012 | 2011 | ||||||||||
| Statutory federal tax rate |
35.0 | % | 35.0 | % | 34.0 | % | ||||||
| State taxes, net of federal benefit |
3.4 | .4 | (4.2 | ) | ||||||||
| Valuation allowance on capital loss carryforwardand state tax credit carryforward |
(.4 | ) | 2.3 | 3.1 | ||||||||
| Adjustment for final positions on filed returns |
(1.5 | ) | (.3 | ) | (.3 | ) | ||||||
| Officer life insurance proceeds |
0 | 0 | (22.4 | ) | ||||||||
| Nondeductible expenses and other, net |
.8 | 4.4 | 3.9 | |||||||||
| Federal tax-exempt interest income |
(.2 | ) | (.4 | ) | (.9 | ) | ||||||
| Federal and state tax credits |
(8.9 | ) | (8.9 | ) | (7.7 | ) | ||||||
|
|
|
|
|
|
|
|||||||
| 28.2 | % | 32.5 | % | 5.5 | % | |||||||
|
|
|
|
|
|
|
|||||||
F-24
Table of Contents
Barrett Business Services, Inc.
Notes to Consolidated Financial Statements (Continued)
| 11. | Income Taxes (Continued) |
The Company has established a valuation allowance for certain deferred tax assets due to uncertainties regarding the Companys ability to generate future taxable investment gains in order to utilize certain investment impairment losses and investment loss carry forwards for tax purposes. The realization of a significant portion of net deferred tax assets is based in part on our estimates of the timing of reversals of certain temporary differences and on the generation of taxable income before such reversals. At December 31, 2013, we maintained a valuation allowance for approximately $1.8 million of federal and state tax benefits that are not expected to be utilized.
The Company is subject to income taxes in U.S. federal and multiple state and local tax jurisdictions. In the major jurisdictions where the Company operates, it is generally no longer subject to income tax examinations by tax authorities for years before 2007. As of December 31, 2013 and 2012, we had no unrecognized tax benefits. We are currently under exam by the State of California.
The Company is subject to income taxes in multiple state and local tax jurisdictions. A portion of the consolidated income the Company generates is not subject to state income tax. Depending on the percentage of this income to total consolidated income, the Companys state effective rate can fluctuate from expectations. As a result of the mix of income subject to state income tax, total state tax expense decreased by approximately $284,000, $498,000 and $502,000 in 2013, 2012 and 2011, respectively.
At December 31, 2013, the Company had capital loss carry forwards of approximately $2.5 million. Unless utilized in earlier tax years, the carry forwards expire in 2015. At December 31, 2013, the Company also had state tax credit carry forwards of $1.1 million, which expire in 2024.
| 12. | Stock Incentive Plans |
The Companys 2009 Stock Incentive Plan (the 2009 Plan), which provides for stock-based awards to Company employees, non-employee directors and outside consultants or advisors, was approved by shareholders on May 13, 2009. No options have been issued to outside consultants or advisors. The number of shares of common stock reserved for issuance under the 2009 Plan is 1,000,000 of which the aggregate number of shares for which incentive stock options may be granted under the Plan is 900,000. No new grants of stock options may be made under the Companys 2003 Stock Incentive Plan (the 2003 Plan). At December 31, 2013, there were option awards covering 400,399 shares outstanding under the 2009 plan, together with the 2003 Plan and its predecessor, the 1993 Stock Incentive Plan. Outstanding options under all the plans generally expire ten years after the date of grant. Options are generally exercisable in four equal annual installments beginning one year after the date of grant.
F-25
Table of Contents
Barrett Business Services, Inc.
Notes to Consolidated Financial Statements (Continued)
| 12. | Stock Incentive Plans (Continued) |
The Company recognizes compensation expense for options awarded under its stock incentive plans based on the grant-date fair value. Compensation expense is attributed to earnings using the straight-line method over the requisite service period.
A summary of the status of the Companys stock options at December 31, 2013, 2012 and 2011, together with changes during the periods then ended, is presented below:
| Number of options |
Weighted average exercise price |
|||||||
| Outstanding at December 31, 2010 |
399,569 | |||||||
| Options granted at market price |
289,200 | $ | 16.06 | |||||
| Options exercised |
(7,475 | ) | 7.24 | |||||
| Options cancelled |
(10,000 | ) | 14.39 | |||||
|
|
|
|||||||
| Outstanding at December 31, 2011 |
671,294 | |||||||
| Options granted at market price |
7,500 | 17.55 | ||||||
| Options exercised |
(131,997 | ) | 13.98 | |||||
| Options cancelled |
(8,100 | ) | 13.85 | |||||
|
|
|
|||||||
| Outstanding at December 31, 2012 |
538,697 | |||||||
| Options exercised |
(138,298 | ) | 13.53 | |||||
|
|
|
|||||||
| Outstanding at December 31, 2013 |
400,399 | |||||||
|
|
|
|||||||
| Available for grant at December 31, 2013 |
543,503 | |||||||
|
|
|
|||||||
The following table presents information on stock options outstanding:
| Year Ended | ||||||||
| December 31, | ||||||||
| (in thousands, except share data) | 2013 | 2012 | ||||||
| Intrinsic value of options exercised in the period |
$ | 6,089 | $ | 895 | ||||
| ($ in thousands, except share data) |
Number of Shares |
Weighted Average Exercise Price |
Weighted Average Remaining Contractual Term (Years) |
Aggregate Intrinsic Value |
||||||||||||
| Stock options: |
||||||||||||||||
| Outstanding December 31, 2013 |
400,399 | $ | 15.05 | 6.02 | $ | 31,106 | ||||||||||
| Exercisable at December 31, 2013 |
186,824 | 13.97 | 4.67 | 14,717 | ||||||||||||
The aggregate intrinsic value of stock options represents the difference between the Companys closing stock price at the end of the period and the relevant exercise price multiplied by the number of options outstanding at the end of the period at each such price.
F-26
Table of Contents
Barrett Business Services, Inc.
Notes to Consolidated Financial Statements (Continued)
| 12. | Stock Incentive Plans (Continued) |
The fair value of stock option awards as determined under the Black-Scholes option-pricing model was estimated with the following weighted-average assumptions:
| 2012 | 2011 | |||||||
| Expected volatility |
65.9 | % | 65.9 | % | ||||
| Risk free interest rate |
2.9 | % | 2.9 | % | ||||
| Expected dividend yield |
2.5 | % | 2.3 | % | ||||
| Expected term |
7.3 years | 7.3 years | ||||||
| Weighted average fair value per share |
$ | 9.08 | $ | 7.20 | ||||
There were no options granted during 2013. There were no options granted during 2012 or 2011 below market price.
During July 2013 and 2012, the Company granted 44,970 and 47,500 restricted stock units at a fair value of $50.28 and $21.44 per share, respectively, which represented the closing price of the Companys stock on the date of grant. The restricted stock units vest in four equal annual installments beginning one year following the date of grant.
The following table presents restricted stock unit activity for 2013:
| Units |
Weighted Average Grant Date Fair Value |
|||||||
| Non-vested at December 31, 2012 |
47,500 | $ | 21.44 | |||||
| Granted |
44,970 | 50.28 | ||||||
| Vested |
(10,302 | ) | 21.44 | |||||
| Cancelled/Forfeited |
(1,573 | ) | 21.44 | |||||
|
|
|
|||||||
| Non-vested at December 31, 2013 |
80,595 | 37.53 | ||||||
|
|
|
|||||||
The following table summarizes stock-based compensation expense related to stock option and restricted stock unit awards (in thousands):
| Year Ended December 31, |
||||||||||||
| 2013 | 2012 | 2011 | ||||||||||
| Stock-based compensation expense included in selling, general and administrative expenses |
$ | 1,016 | $ | 695 | $ | 473 | ||||||
| Deferred income taxes |
404 | 272 | 188 | |||||||||
|
|
|
|
|
|
|
|||||||
| Stock-based compensation expense related to stock options and restricted stock units, net of tax |
$ | 612 | $ | 423 |
$
|
285 |
|
|||||
|
|
|
|
|
|
|
|||||||
As of December 31, 2013, unrecognized compensation expense related to stock options and restricted stock units was $3.8 million with a weighted average remaining contractual period of 3.61 years.
F-27
Table of Contents
Barrett Business Services, Inc.
Notes to Consolidated Financial Statements (Continued)
| 12. | Stock Incentive Plans (Continued) |
The following table summarizes information about stock options outstanding at December 31, 2013:
| Options outstanding |
Options exercisable | |||||||||||||||||
| Exercise price range |
Number of shares |
Weighted- average exercise price |
Weighted- average remaining contractual life (years) |
Exercisable at December 31, 2013 |
Weighted- average exercise price |
|||||||||||||
| $2.01 - $ 2.58 |
2,250 | $ | 2.29 | Indefinite | 2,250 | $ | 2.29 | |||||||||||
| 8.82 - 17.55 |
398,149 | 15.13 | 6.1 | 184,574 | 14.11 | |||||||||||||
|
|
|
|
|
|
|
|
|
|||||||||||
| 400,399 | 15.05 | 186,824 | 13.97 | |||||||||||||||
|
|
|
|
|
|
|
|
|
|||||||||||
| 13. | Stock Repurchase Program |
The Company maintains a stock repurchase program approved by the Board of Directors, which authorizes the repurchase of shares from time to time in open market purchases. The repurchase program currently allows for the repurchase of approximately 1.2 million additional shares as of December 31, 2013.
No share repurchases were made under the repurchase program during 2013 and 2012. During 2011, the Company repurchased 339,384 shares for a weighted average price of $14.08 per share.
| 14. | Litigation |
The Company is subject to legal proceedings and claims, which arise in the ordinary course of our business. In the opinion of management, the amount of ultimate liability with respect to currently pending or threatened actions is not expected to materially affect the consolidated financial position or results of operations of the Company.
F-28
Table of Contents
Barrett Business Services, Inc.
Notes to Consolidated Financial Statements (Continued)
| 15. | Quarterly Financial Information (Unaudited) |
(in thousands, except per share amounts and market price per share)
| First Quarter |
Second Quarter |
Third Quarter |
Fourth Quarter |
|||||||||||||
| Year ended December 31, 2013 |
||||||||||||||||
| Revenues |
$ | 111,551 | $ | 128,798 | $ | 147,971 | $ | 144,524 | ||||||||
| Cost of revenues |
103,240 | 105,072 | 117,785 | 120,223 | ||||||||||||
| Net (loss) income |
(2,549 | ) | 5,886 | 8,994 | 5,561 | |||||||||||
| Basic (loss) earnings per share |
(.36 | ) | .83 | 1.26 | .78 | |||||||||||
| Diluted (loss) earnings per share |
(.36 | ) | .80 | 1.21 | .74 | |||||||||||
| Common stock market prices: |
||||||||||||||||
| High |
$ | 53.27 | $ | 62.82 | $ | 73.49 | $ | 98.00 | ||||||||
| Low |
38.15 | 48.50 | 48.08 | 66.33 | ||||||||||||
| Year ended December 31, 2012 |
||||||||||||||||
| Revenues |
$ | 82,422 | $ | 95,500 | $ | 111,069 | $ | 113,661 | ||||||||
| Cost of revenues |
75,865 | 79,159 | 89,505 | 91,409 | ||||||||||||
| Net (loss) income |
(2,213 | ) | 3,743 | 5,812 | 5,789 | |||||||||||
| Basic (loss) earnings per share |
(.22 | ) | .54 | .83 | .83 | |||||||||||
| Diluted (loss) earnings per share |
(.22 | ) | .53 | .81 | .80 | |||||||||||
| Common stock market prices: |
||||||||||||||||
| High |
$ | 21.10 | $ | 21.45 | $ | 28.96 | $ | 39.49 | ||||||||
| Low |
15.68 | 18.88 | 19.99 | 26.19 | ||||||||||||
| 16. | Subsequent Event |
Effective February 13, 2014, the Company entered into a workers compensation insurance arrangement with ACE Group to provide coverage to BBSI employees in California beginning in the first quarter of 2014. The agreement will be effective through January 2015 with the potential for annual renewals thereafter.
The arrangement, typically known as a fronted program, will provide BBSI a licensed, admitted insurance carrier in California to issue policies on behalf of BBSI without the intention of transferring any of the workers compensation risk for the first $5.0 million per claim. The risk of loss up to the first $5.0 million per claim will be retained by BBSI through an indemnity agreement. While this portion of the risk of loss remains with BBSI, ACE assumes credit risk should BBSI be unable to satisfy its indemnification obligations to ACE. ACE will also bear the economic burden for all costs in excess of $5.0 million per claim. The arrangement with ACE addresses the requirements of California Senate Bill 863 under which the Company cannot continue its self-insurance program in California beyond January 1, 2015.
F-29
Table of Contents
Pursuant to the requirements of Section 13 or 15(d) of the Securities Exchange Act of 1934, the Registrant has duly caused this report to be signed on its behalf by the undersigned, thereunto duly authorized.
| BARRETT BUSINESS SERVICES, INC. Registrant | ||||||
| Date: March 14, 2014 |
By: | /s/ James D. Miller |
||||
| James D. Miller | ||||||
| Vice President-Finance, Treasurer and Secretary |
||||||
Pursuant to the requirements of the Securities Exchange Act of 1934, this report has been signed below by the following persons on behalf of the Registrant and in the capacities indicated on the 14th day of March, 2014.
Principal Executive Officer and Director:
| /s/ Michael L. Elich |
President and Chief Executive | |||
| Michael L. Elich | Officer and Director | |||
| Principal Financial and Accounting Officer: | ||||
| /s/ James D. Miller |
Vice President-Finance, Treasurer and | |||
| James D. Miller | Secretary | |||
| Majority of Directors: | ||||
| /s/ Thomas J. Carley |
Director | |||
| Thomas J. Carley | ||||
| /s/ James B. Hicks |
Director | |||
| James B. Hicks, Ph.D. | ||||
| /s/ Roger L. Johnson |
Director | |||
| Roger L. Johnson | ||||
| /s/ Jon L. Justesen |
Director | |||
| Jon L. Justesen | ||||
| /s/ Anthony Meeker |
Chairman of the Board and Director | |||
| Anthony Meeker | ||||
Table of Contents
| 3.1 | Charter of the Registrant, as amended, through March 27, 2012. Incorporated by reference to Exhibit 3.1 to the Registrants Quarterly Report on Form 10-Q for the quarter ended March 31, 2012. | |
| 3.2 | Bylaws of the Registrant, as amended effective February 3, 2014. Incorporated by reference to Exhibit 3.2 to the Registrants Current Report on Form 8-K filed on February 7, 2014. | |
| 4.1 | Restated Credit Agreement dated as of November 1, 2012, between the Registrant and Wells Fargo Bank, National Association (Wells Fargo). Incorporated by reference to Exhibit 4.1 to the Registrants Quarterly Report on Form 10-Q for the quarter ended September 30, 2012 (the 2012 Third Quarter 10-Q). | |
| 4.2 | Revolving Reducing Note dated September 18, 2012, of the Registrant. Incorporated by reference to Exhibit 4.2 to the 2012 Third Quarter 10-Q. | |
| 4.3 | Standby Letter of Credit Agreement dated as of September 18, 2012, between the Registrant and Wells Fargo. Incorporated by reference to Exhibit 4.3 to the 2012 Third Quarter 10-Q. | |
| 4.4 | Term Note dated November 1, 2012, of the Registrant. Incorporated by reference to Exhibit 4.4 to the 2012 Third Quarter 10-Q. | |
| 4.5 | First Amendment to Restated Credit Agreement dated as of June 14, 2013, between the Registrant and Wells Fargo. Incorporated by reference to Exhibit 4.1 to the Registrants Quarterly Report on Form 10-Q for the quarter ended June 30, 2013 (the 2013 Second Quarter 10-Q). | |
| 4.6 | Security Agreement: Specific Rights to Payment dated as of June 14, 2013, between the Registrant and Wells Fargo. Incorporated by reference to Exhibit 4.2 to the 2013 Second Quarter 10-Q. | |
| The Registrant has incurred additional long-term indebtedness as to which the amount involved is less than 10 percent of the Registrants total assets. The Registrant agrees to furnish copies of the instruments relating to such indebtedness to the Commission upon request. | ||
| 10.1 | Second Amended and Restated 1993 Stock Incentive Plan of the Registrant. Incorporated by reference to Exhibit 10.1 to the Registrants Annual Report on Form 10-K for the year ended December 31, 2001. | |
| 10.2 | 2003 Stock Incentive Plan of the Registrant (the 2003 Plan). Incorporated by reference to Exhibit 10.1 to the Registrants Quarterly Report on Form 10-Q for the quarter ended March 31, 2003.* | |
| 10.3 | Form of Incentive Stock Option Agreement under the 2003 Plan. Incorporated by reference to Exhibit 10.11 to the Registrants Annual Report on Form 10-K for the year ended December 31, 2003 (the 2003 10-K).* | |
| 10.4 | Form of Nonqualified Stock Option Agreement under the 2003 Plan. Incorporated by reference to Exhibit 10.12 to the 2003 10-K.* | |
| 10.5 | Form of Incentive Stock Option Agreement relating to July 2005 option grants under the 2003 Plan. Incorporated by reference to Exhibit 10.11 to the Registrants Annual Report on Form 10-K for the year ended December 31, 2005 (the 2005 10-K).* | |
Table of Contents
| 10.6 | Form of Nonqualified Stock Option Agreement relating to July 2005 option grants under the 2003 Plan. Incorporated by reference to Exhibit 10.12 to the 2005 10-K.* | |
| 10.7 | Form of Annual Director Option Agreement for July 2005 option grants under the 2003 Plan. Incorporated by reference to Exhibit 10.14 to the 2005 10-K.* | |
| 10.8 | Form of Incentive Stock Option Award Agreement relating to January 2009 option grants under the 2003 Plan. Incorporated by reference to Exhibit 10.16 to the Registrants Annual Report on Form 10-K for the year ended December 31, 2008 (the 2008 10-K).* | |
| 10.9 | Form of Employee Nonqualified Stock Option Award Agreement relating to January 2009 option grants under the 2003 Plan. Incorporated by reference to Exhibit 10.17 to the 2008 10-K.* | |
| 10.10 | Form of Non-Employee Director Option Award Agreement relating to January 2009 option grants under the 2003 Plan. Incorporated by reference to Exhibit 10.18 to the 2008 10-K.* | |
| 10.11 | 2009 Stock Incentive Plan of the Registrant (the 2009 Plan). Incorporated by reference to Exhibit 10.2 to the Registrants Quarterly Report on Form 10-Q for the quarter ended June 30, 2009.* | |
| 10.12 | Form of Incentive Stock Option Award Agreement under the 2009 Plan. Incorporated by reference to Exhibit 10.1 to the Registrants Quarterly Report on Form 10-Q for the quarter ended March 31, 2010 (the 2010 First Quarter 10-Q).* | |
| 10.13 | Form of Employee Nonqualified Stock Option Award Agreement under the 2009 Plan. Incorporated by reference to Exhibit 10.2 to the 2010 First Quarter 10-Q.* | |
| 10.14 | Form of Non-Employee Director Nonqualified Stock Option Award Agreement under the 2009 Plan. Incorporated by reference to Exhibit 10.3 to the 2010 First Quarter 10-Q.* | |
| 10.15 | Employment Agreement between the Registrant and Michael L. Elich, dated September 25, 2001. Incorporated by reference to Exhibit 10.17 to the Registrants Registration Statement on Form S-2 (Registration No. 333-126496) filed July 11, 2005.* | |
| 10.16 | Summary of compensatory arrangements for non-employee directors of the Registrant.* | |
| 10.17 | Form of Incentive Stock Option Award Agreement under the Registrants 2009 Stock Incentive Plan (the 2009 Plan). Incorporated by reference to Exhibit 10.1 to the Registrants Quarterly Report on Form 10-Q for the quarter ended March 31, 2011 (the 2011 First Quarter 10-Q).* | |
| 10.18 | Form of Employee Nonqualified Stock Option Award Agreement under the 2009 Plan. Incorporated by reference to Exhibit 10.2 to the 2011 First Quarter 10-Q.* | |
| 10.19 | Form of Non-Employee Director Nonqualified Stock Option Award Agreement under the 2009 Plan. Incorporated by reference to Exhibit 10.3 to the 2011 First Quarter 10-Q.* | |
| 10.20 | Change in Control Employment Agreement between the Registrant and Michael L. Elich, dated April 12, 2011. Incorporated by reference to Exhibit 10.4 to the 2011 First Quarter 10-Q.* | |
Table of Contents
| 10.21 | Change in Control Employment Agreement between the Registrant and Gregory R. Vaughn, dated April 12, 2011. Incorporated by reference to Exhibit 10.5 to the 2011 First Quarter 10-Q.* | |
| 10.22 | Change in Control Employment Agreement between the Registrant and James D. Miller, dated April 12, 2011. Incorporated by reference to Exhibit 10.6 to the 2011 First Quarter 10-Q.* | |
| 10.23 | Form of Indemnification Agreement with each outside director of Barrett Business Services, Inc. Incorporated by reference to Exhibit 10.1 to the registrants Current Report on Form 8-K filed April 16, 2012. | |
| 10.24 | Summary of Annual Cash Incentive Compensation Plan for Executives of the Registrant.* | |
| 10.25 | Form of Employee Restricted Stock Units Award Agreement under the 2009 Plan. Incorporated by reference to Exhibit 10.1 to the 2012 Third Quarter 10-Q.* | |
| 10.26 | Form of Non-Employee Director Restricted Stock Units Award Agreement under the 2009 Plan. Incorporated by reference to Exhibit 10.2 to the 2012 Third Quarter 10-Q.* | |
| 10.27 | Death Benefit Agreement entered into by the Registrant and Michael L. Elich effective January 1, 2014.* | |
| 10.28 | Death Benefit Agreement entered into by the Registrant and Gregory R. Vaughn effective January 1, 2014.* | |
| 10.29 | Death Benefit Agreement entered into by the Registrant and James D. Miller effective January 1, 2014.* | |
| 21 | Subsidiaries of the Registrant. | |
| 23.1 | Consent of Moss Adams LLP, Independent Registered Public Accounting Firm. | |
| 31.1 | Certification of Chief Executive Officer pursuant to Rule 13a-14(a). | |
| 31.2 | Certification of Chief Financial Officer pursuant to Rule 13a-14(a). | |
| 32 | Certification pursuant to 18 U.S.C. Section 1350. | |
| 99.1 | Description of Capital Stock. Incorporated by reference to Exhibit 99.1 to the Registrants Quarterly Report on Form 10-Q for the quarter ended June 30, 2012. | |
| 101.INS | XBRL Instance Document | |
| 101.SCH | XBRL Taxonomy Extension Schema Document | |
| 101.CAL | XBRL Taxonomy Extension Calculation Linkbase Document | |
| 101.DEF | XBRL Taxonomy Extension Definition Linkbase Document* | |
| 101.LAB | XBRL Taxonomy Extension Label Linkbase Document | |
| 101.PRE | XBRL Taxonomy Extension Presentation Linkbase Document | |
| * | Denotes a management contract or a compensatory plan or arrangement. |
| ** | Except as otherwise indicated, the SEC File Number for all exhibits is 000-21866. |